FIGURE 2.
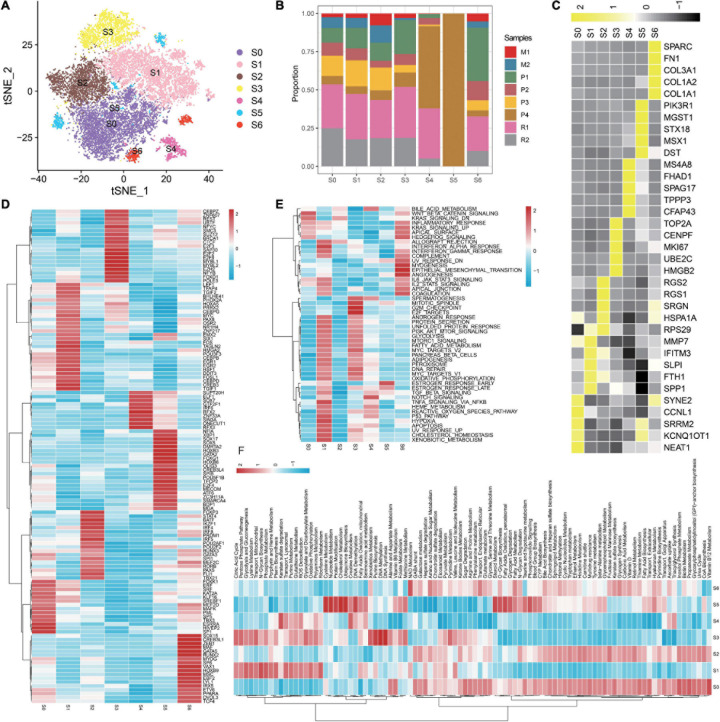
Detailed characterization of malignant epithelial cells. (A) tSNE plot showing seven subgroups generated from malignant epithelial cells. (B) Heatmap showing the average expression of the top five markers across different subgroups. (C) The proportion of diverse subgroups across different sample origins. Differences in the activities of the TFs (D), HALLMARK pathway (E), and metabolic pathways (F) in each malignant epithelial subgroup.

