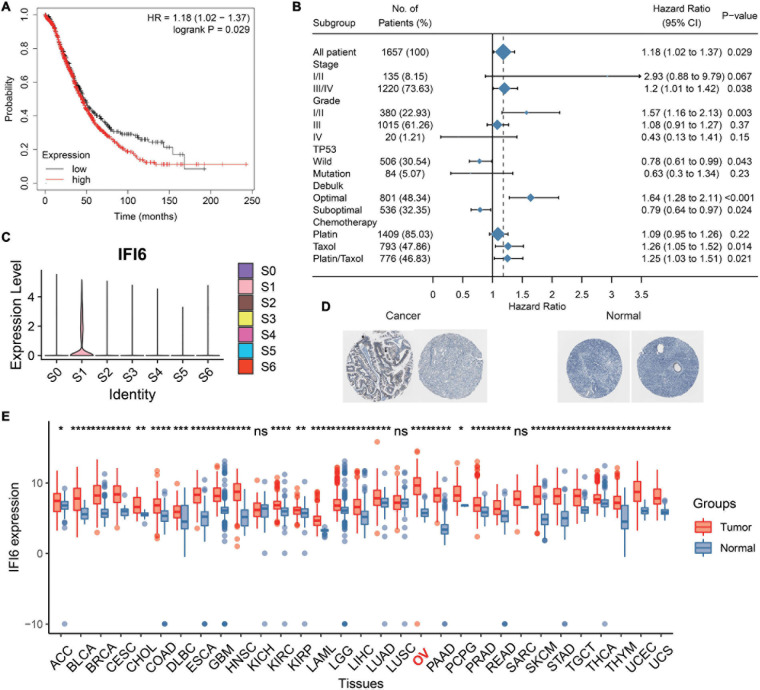
FIGURE 5.
Analysis of prognosis and expression level of IFI6 in OC. (A) Kaplan–Meier curve illustrating higher IFI6 accompanied by poor OS. (B) Survival associated with IFI6 in different subgroups of OC patients. (C) IFI6 has a high expression in S1. (D) Representative protein expression levels of IFI6 were high in OCs based on the Human Protein Atlas database. (E) Box plot showing higher IFI6 in OCs than paired normal samples.

