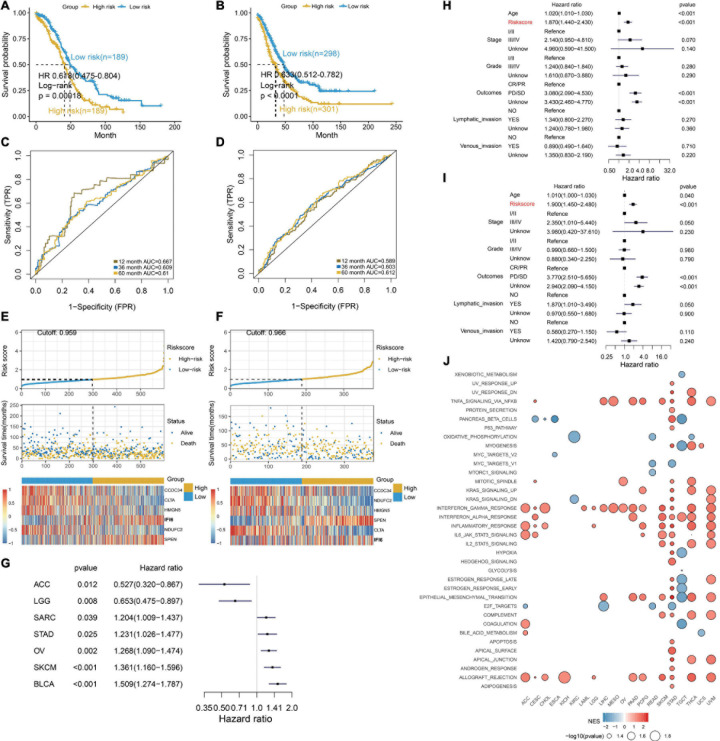
FIGURE 7.
Excellent prognosis of the RiskScore. (A,B) Kaplan–Meier survival curves, (C,D) time-dependent ROC curve analyses, (E,F) RiskScore distribution, survival status, and gene expression profile for patients in high- and low-RiskScore groups in the TCGA OC cohort and GEO OC dataset. (G) Forest plot illustrating the OS of the RiskScore in multiple cancers. SARC, sarcoma; STAD, stomach cancer; OV, ovarian cancer; SKCM, Melanoma; BLCA, bladder cancer; ACC, adrenocortical cancer; LGG, lower grade glioma. (H,I) RiskScore is determined to be an independent and robust prognostic factor for OC samples by univariate Cox regression (H) and multivariable Cox regression (I) analysis. (J) Dot plot showing the functions of RiskScore across multiple cancers.

