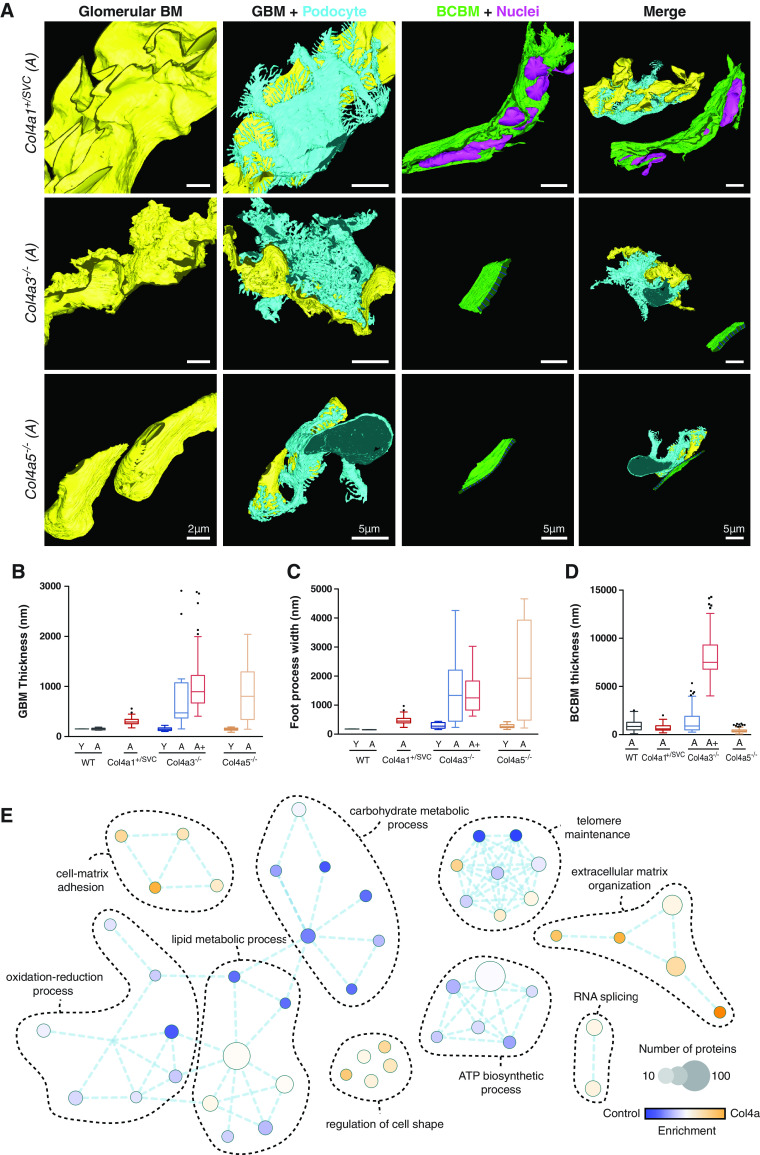
Figure 1.
Identification of glomerular basement membrane and Bowman's capsule abnormalities in Col4a mutant mice. (A) Segmentation and modeling of serial block-face scanning electron microscopy data. Glomerular structure is visualized in Alport (Col4a3−/− and Col4a5−/−) and Col4a1+/SVC mice. Col4a1+/SVC mice demonstrated splitting of Bowman’s capsule with enclosed nuclei. Col4a3−/− mice presented irregular GBM and progressive thickening of Bowman’s capsule, whereas Bowman’s capsule was conserved in the Col4a5−/− Alport mouse model. GBM (yellow), podocyte cell body with foot processes (light blue), and Bowman’s capsule BM (green) were reconstructed. Dark blue lines highlight the thickness of the Bowman’s capsule BM. Nuclei of cells intercalating the BM in Col4a1+/SVC are highlighted in pink. The analyzed Col4a1+/SVC mice received treatment with 4-sodium phenyl butyric acid, as described previously, which did not affect the kidney phenotype.33 Quantification of (B) GBM thickness, (C) podocyte foot process width, and (D) Bowman’s capsule BM (BCBM) thickness. Young (Y) mice were aged 6–8 weeks, adult (A) mice were 16–18 weeks old, and aged (A+) mice were 28 weeks old. Box-and-whisker plots represent the median, where the box represents interquartile range and whiskers represent the tenth to 90th percentile. n=1 biologic sample per model. (E) GO enrichment map analysis was performed on 719 proteins detected by mass spectrometry with altered abundance (>1.4-fold; P<0.1) in Col4a1+/svc, Col4a3−/−, and Col4a5−/− mice at all analyzed ages compared with aged-matched control mice. Over-represented biological processes are presented as nodes, and color represents Bonferroni-corrected P value (the lower the P value, the more intense the node color). Edge weight represents the overlap between the proteins in the connected nodes. n=5 biologic samples per mouse model studied. WT, wild type.

