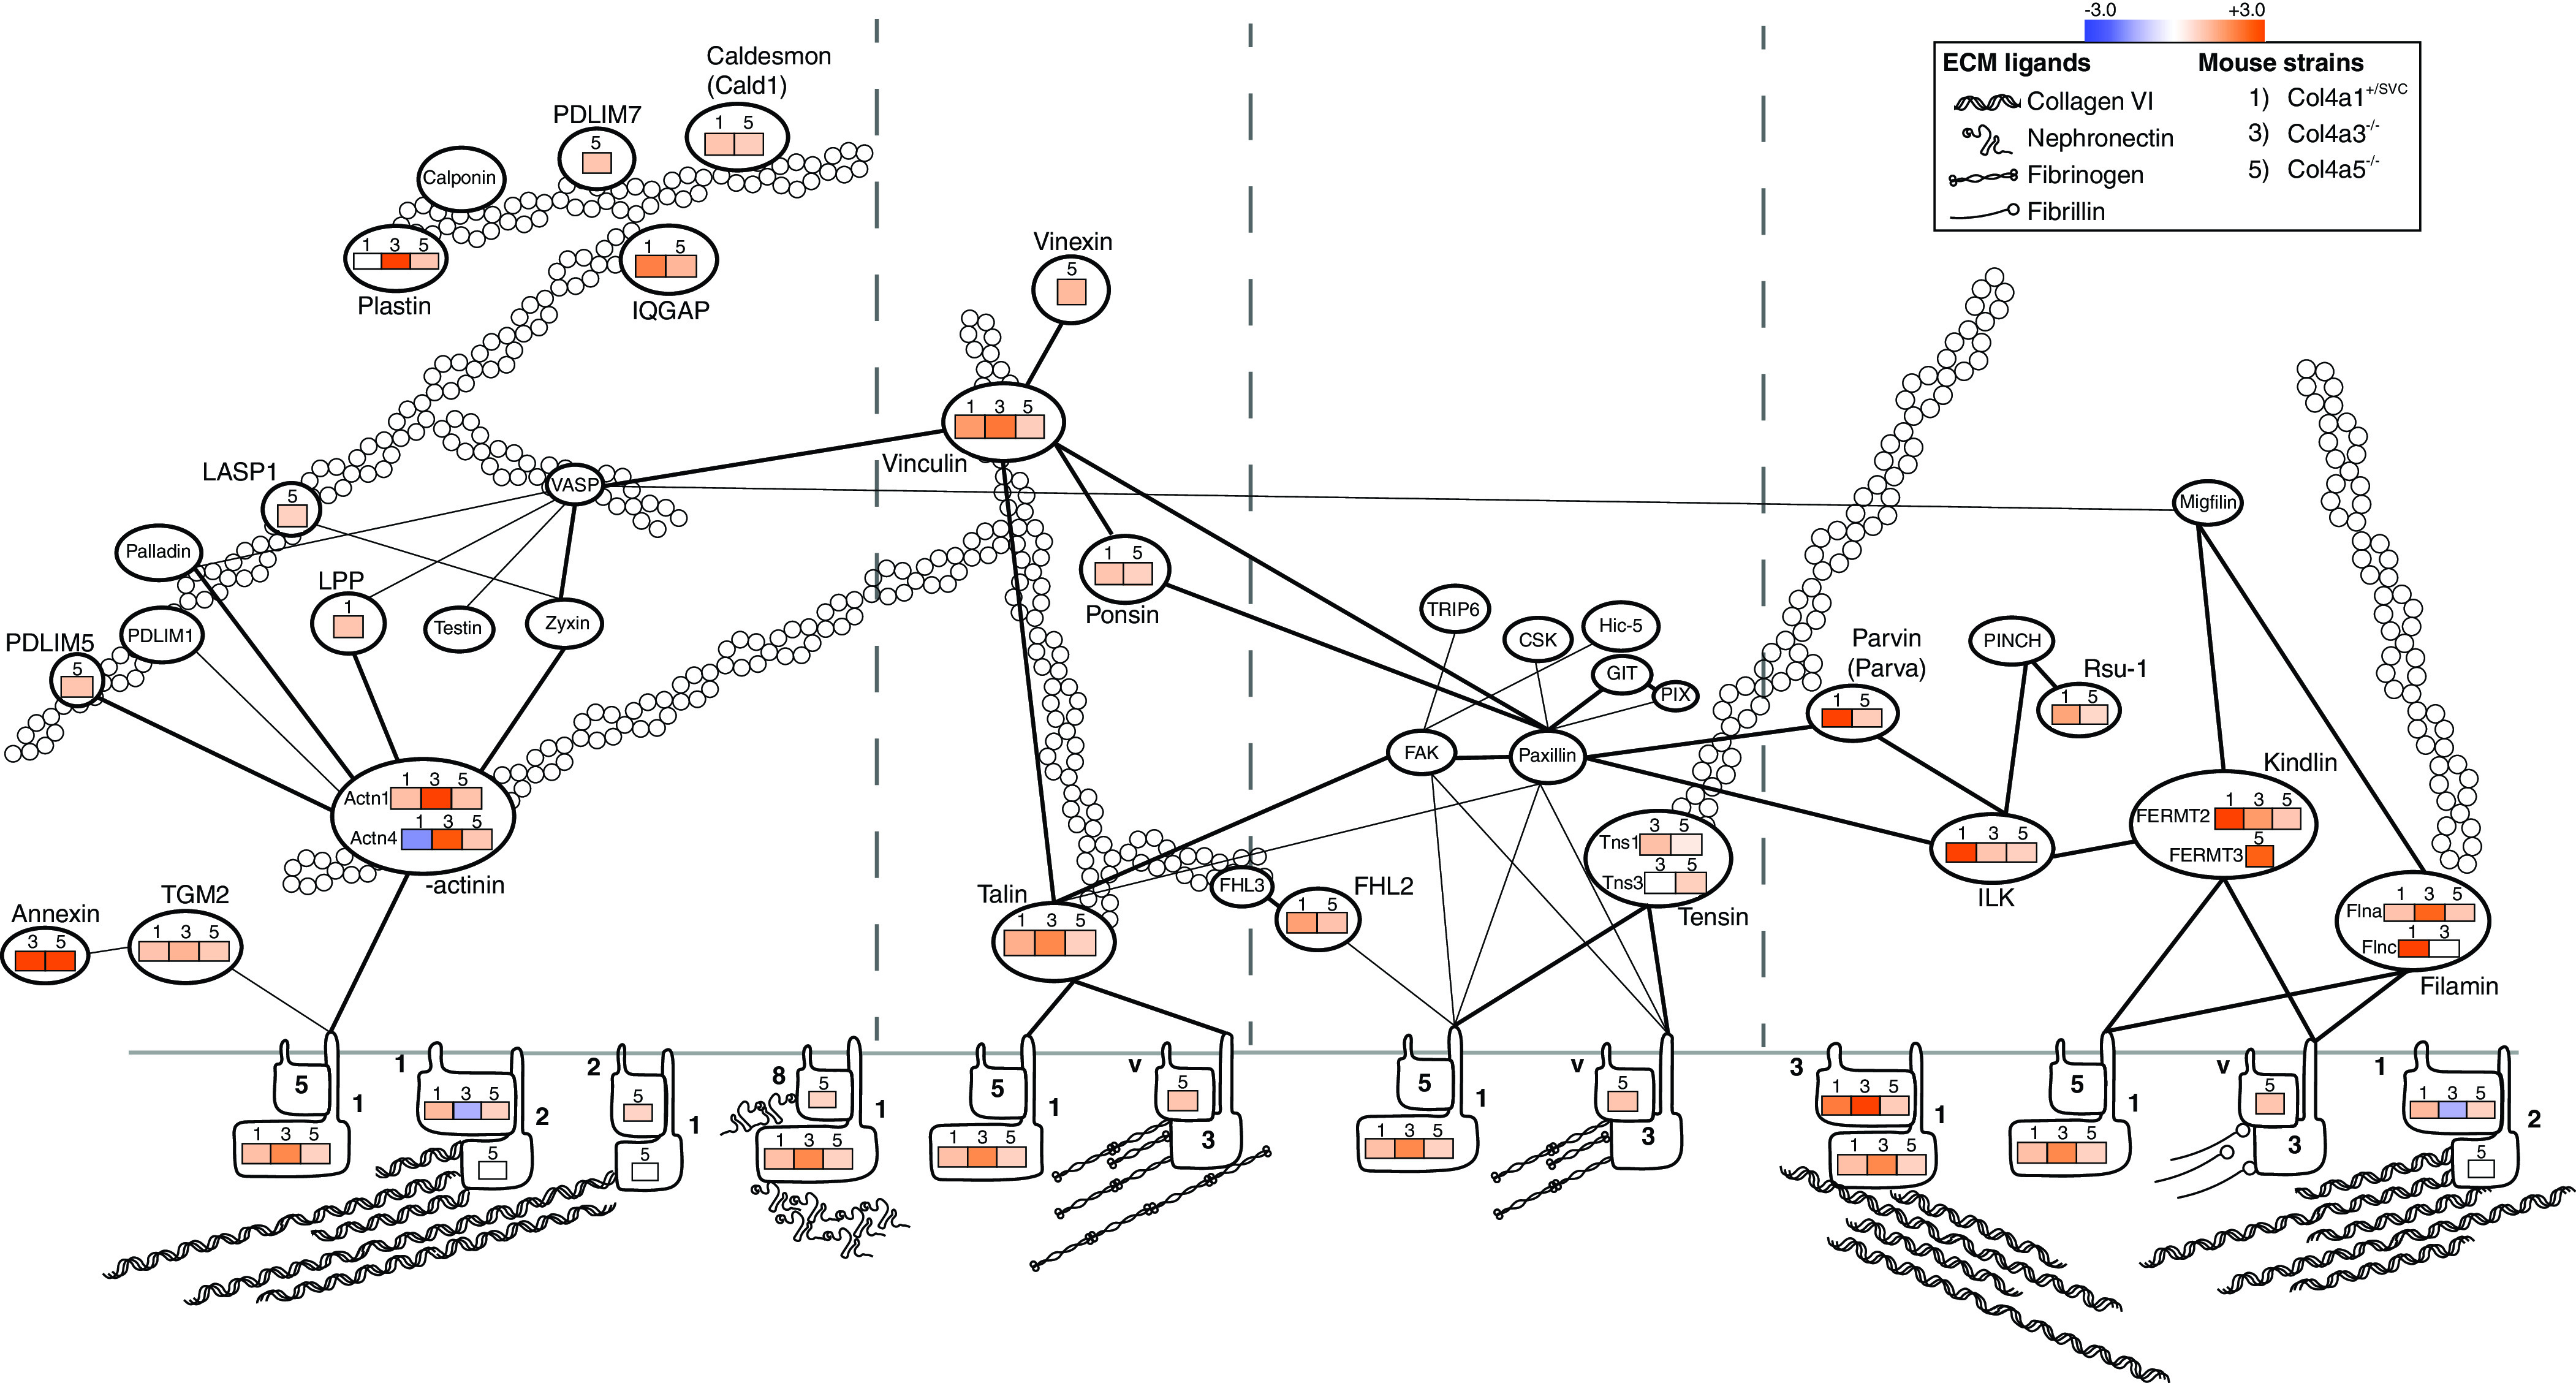
Figure 4.

Protein abundance of cell-matrix adhesion components increases in Col4a mutants. Unsupervised hierarchical clustered heat map displaying the fold enrichment of adhesion proteins detected in 6- to 8-week-old Col4a1+/svc, Col4a3−/−, and Col4a5−/− mass spectrometry datasets compared with their respective control. Orange represents increased (+) abundance in disease relative to control; blue represents decreased (−) abundance in disease relative to control. Adhesion proteins are displayed along the four different signaling axes to the actin cytoskeleton, as described previously.38
