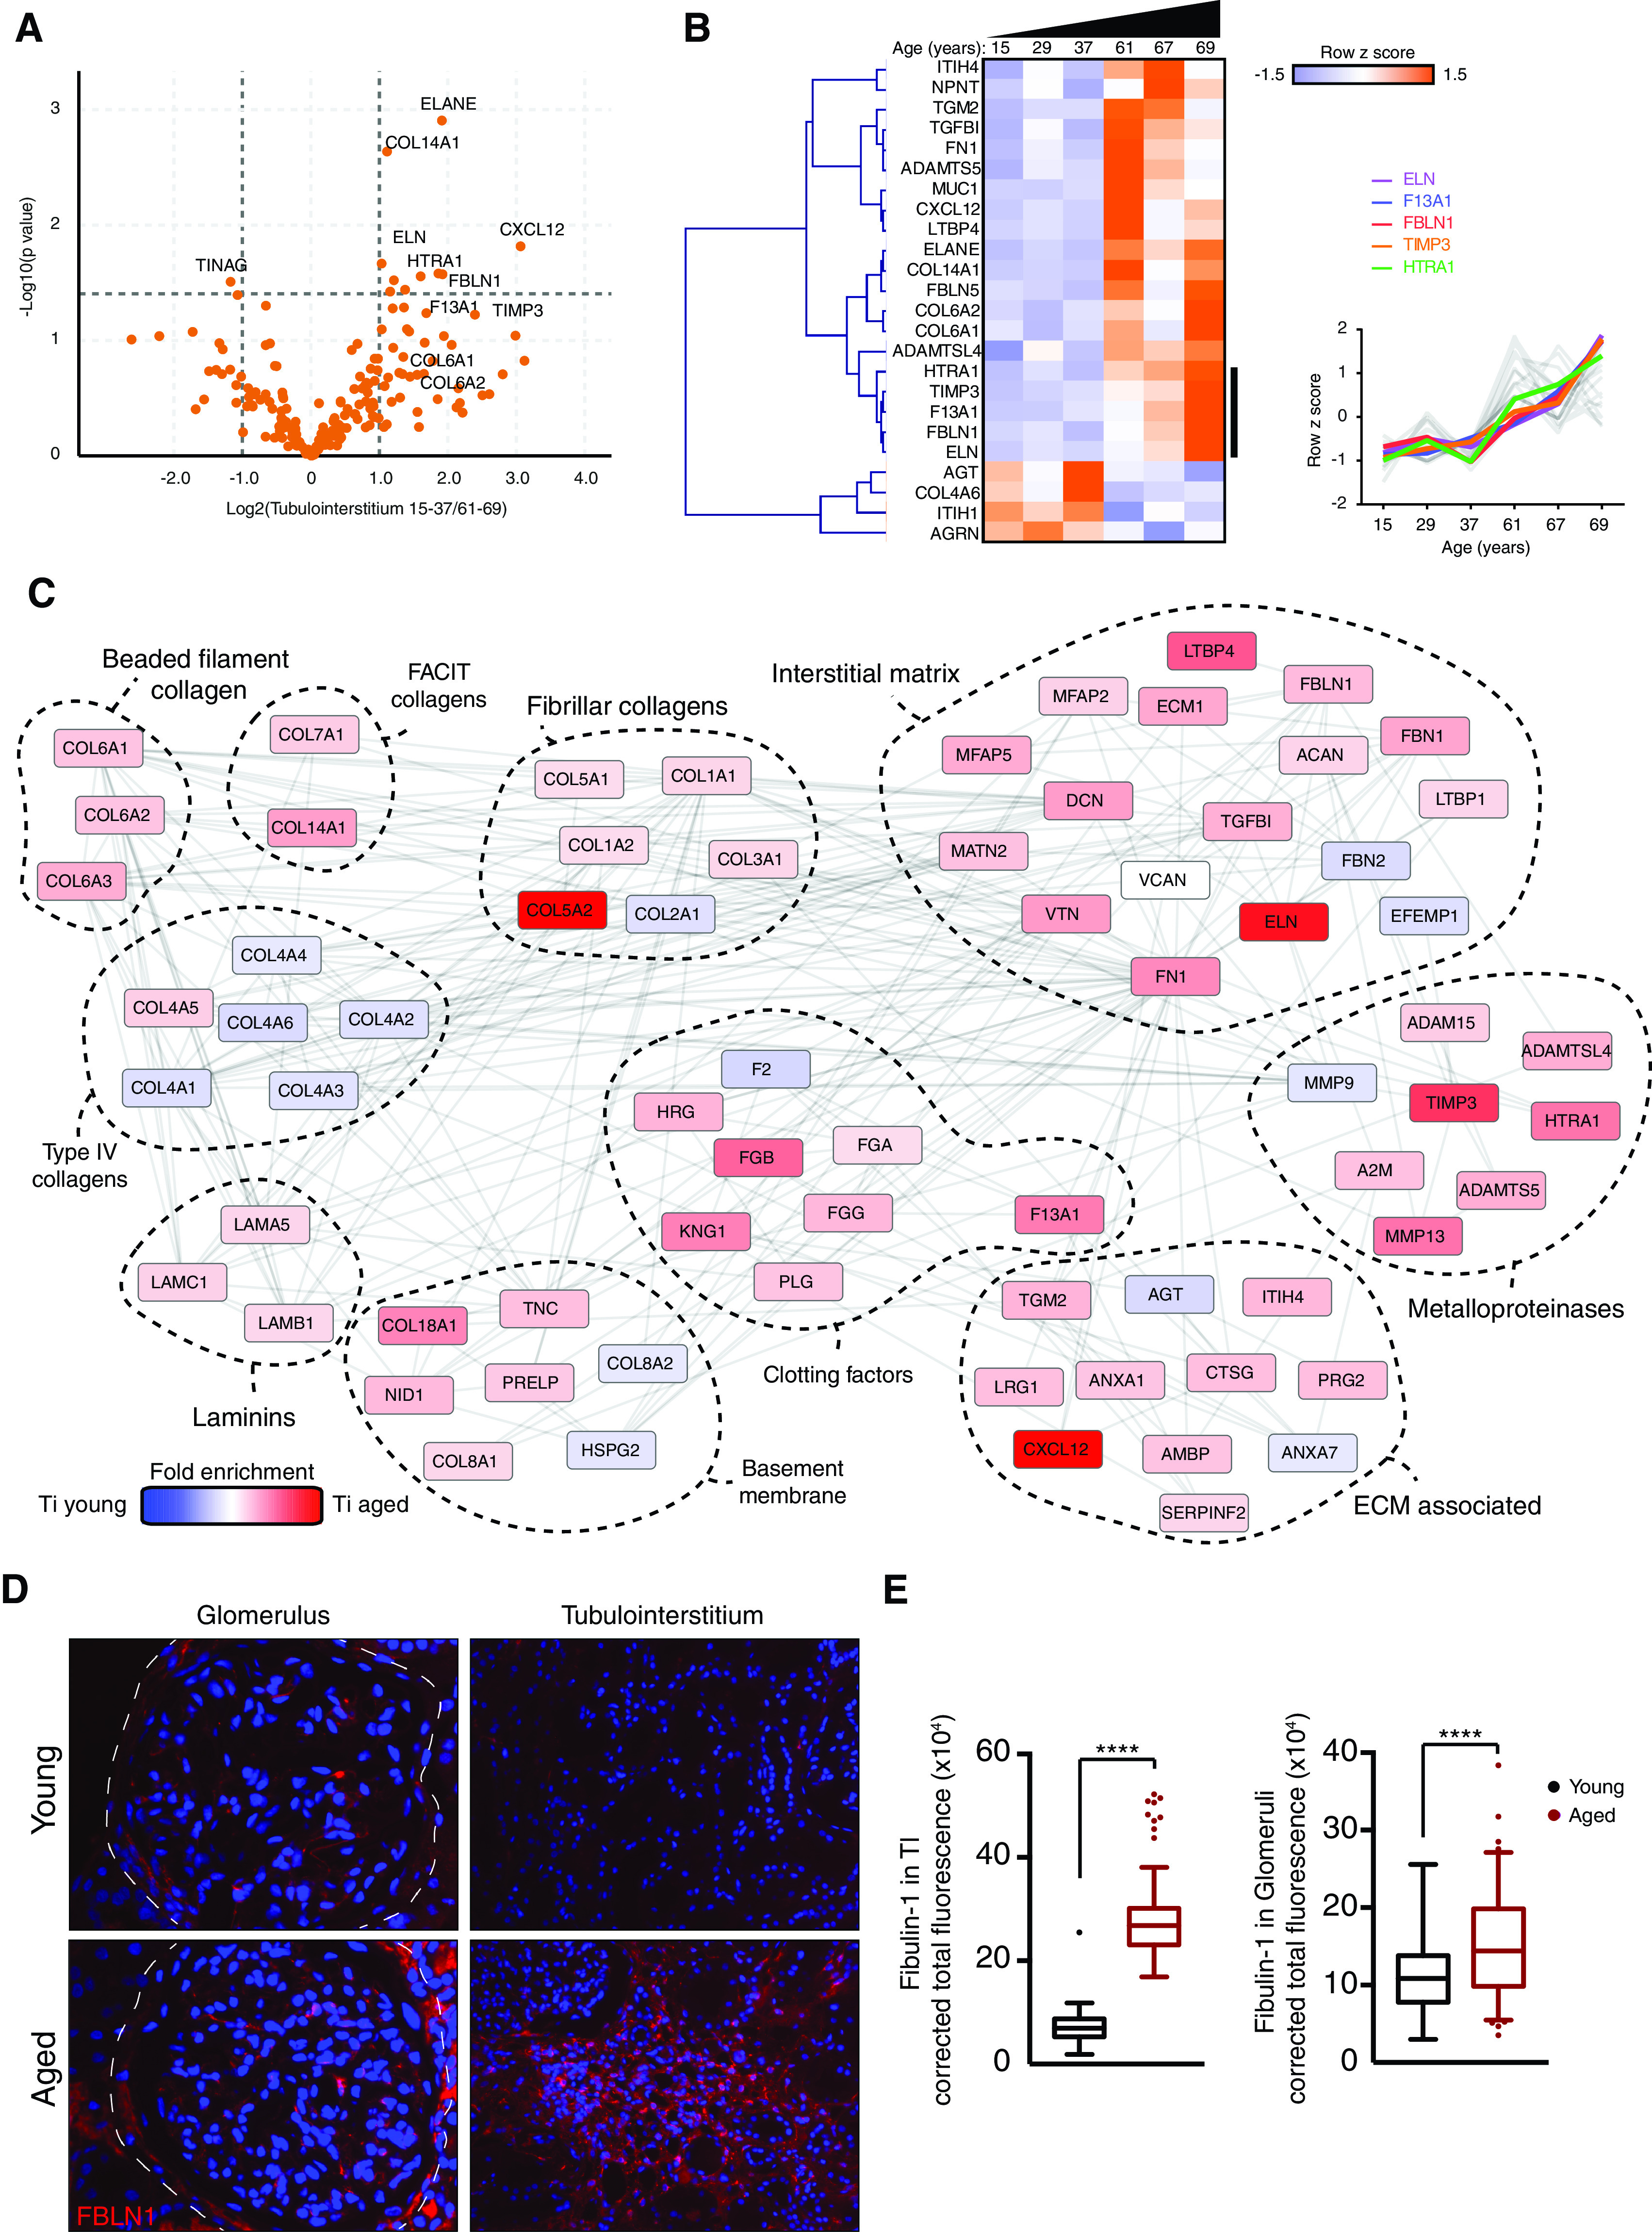
Figure 6.

Matrix composition of the human tubulointerstitium changes with age. TI matrix was isolated from young (15, 29, 37 years) and aged (61, 67, 69 years) human kidney samples. (A) Volcano plots of proteins detected in ECM fractions demonstrate differential protein abundance shown as log2(fold change) of aged over young TI on the x axis and −log10(P value) on the y axis. (B) Unsupervised hierarchical clustered heat map displaying ECM proteins detected in young and aged glomerular datasets. Data were standardized by row z-score and grouped in MeV using Pearson correlation complete-linkage clustering. Inset line graph shows increased collagen VI protein abundance with age. (C) Protein-protein interaction network of altered human TI matrisome proteins. Mass spectrometry data from matrix-enriched protein fractions were filtered for known matrisome proteins. These proteins were mapped onto a merged human, mouse, and rat interactome. Nodes represent proteins and edges represent reported protein-protein interactions. Color represents fold enrichment to datasets, with increased abundance in aged human TI samples illustrated in red, and increased abundance in young human TI samples illustrated in blue. Proteins are grouped functionally. (D) Sections of normal human kidneys were stained with an antibody to fibulin-1 (FBLN1; red) and nuclei were stained with Hoechst 33342 (blue). Representative images are shown. Original magnification, ×40 in left panel; ×20 in right panel. (E) The fluorescent signal in 20 fields per kidney was quantified using ImageJ. ***P<0.001, ****P<0.0001.
