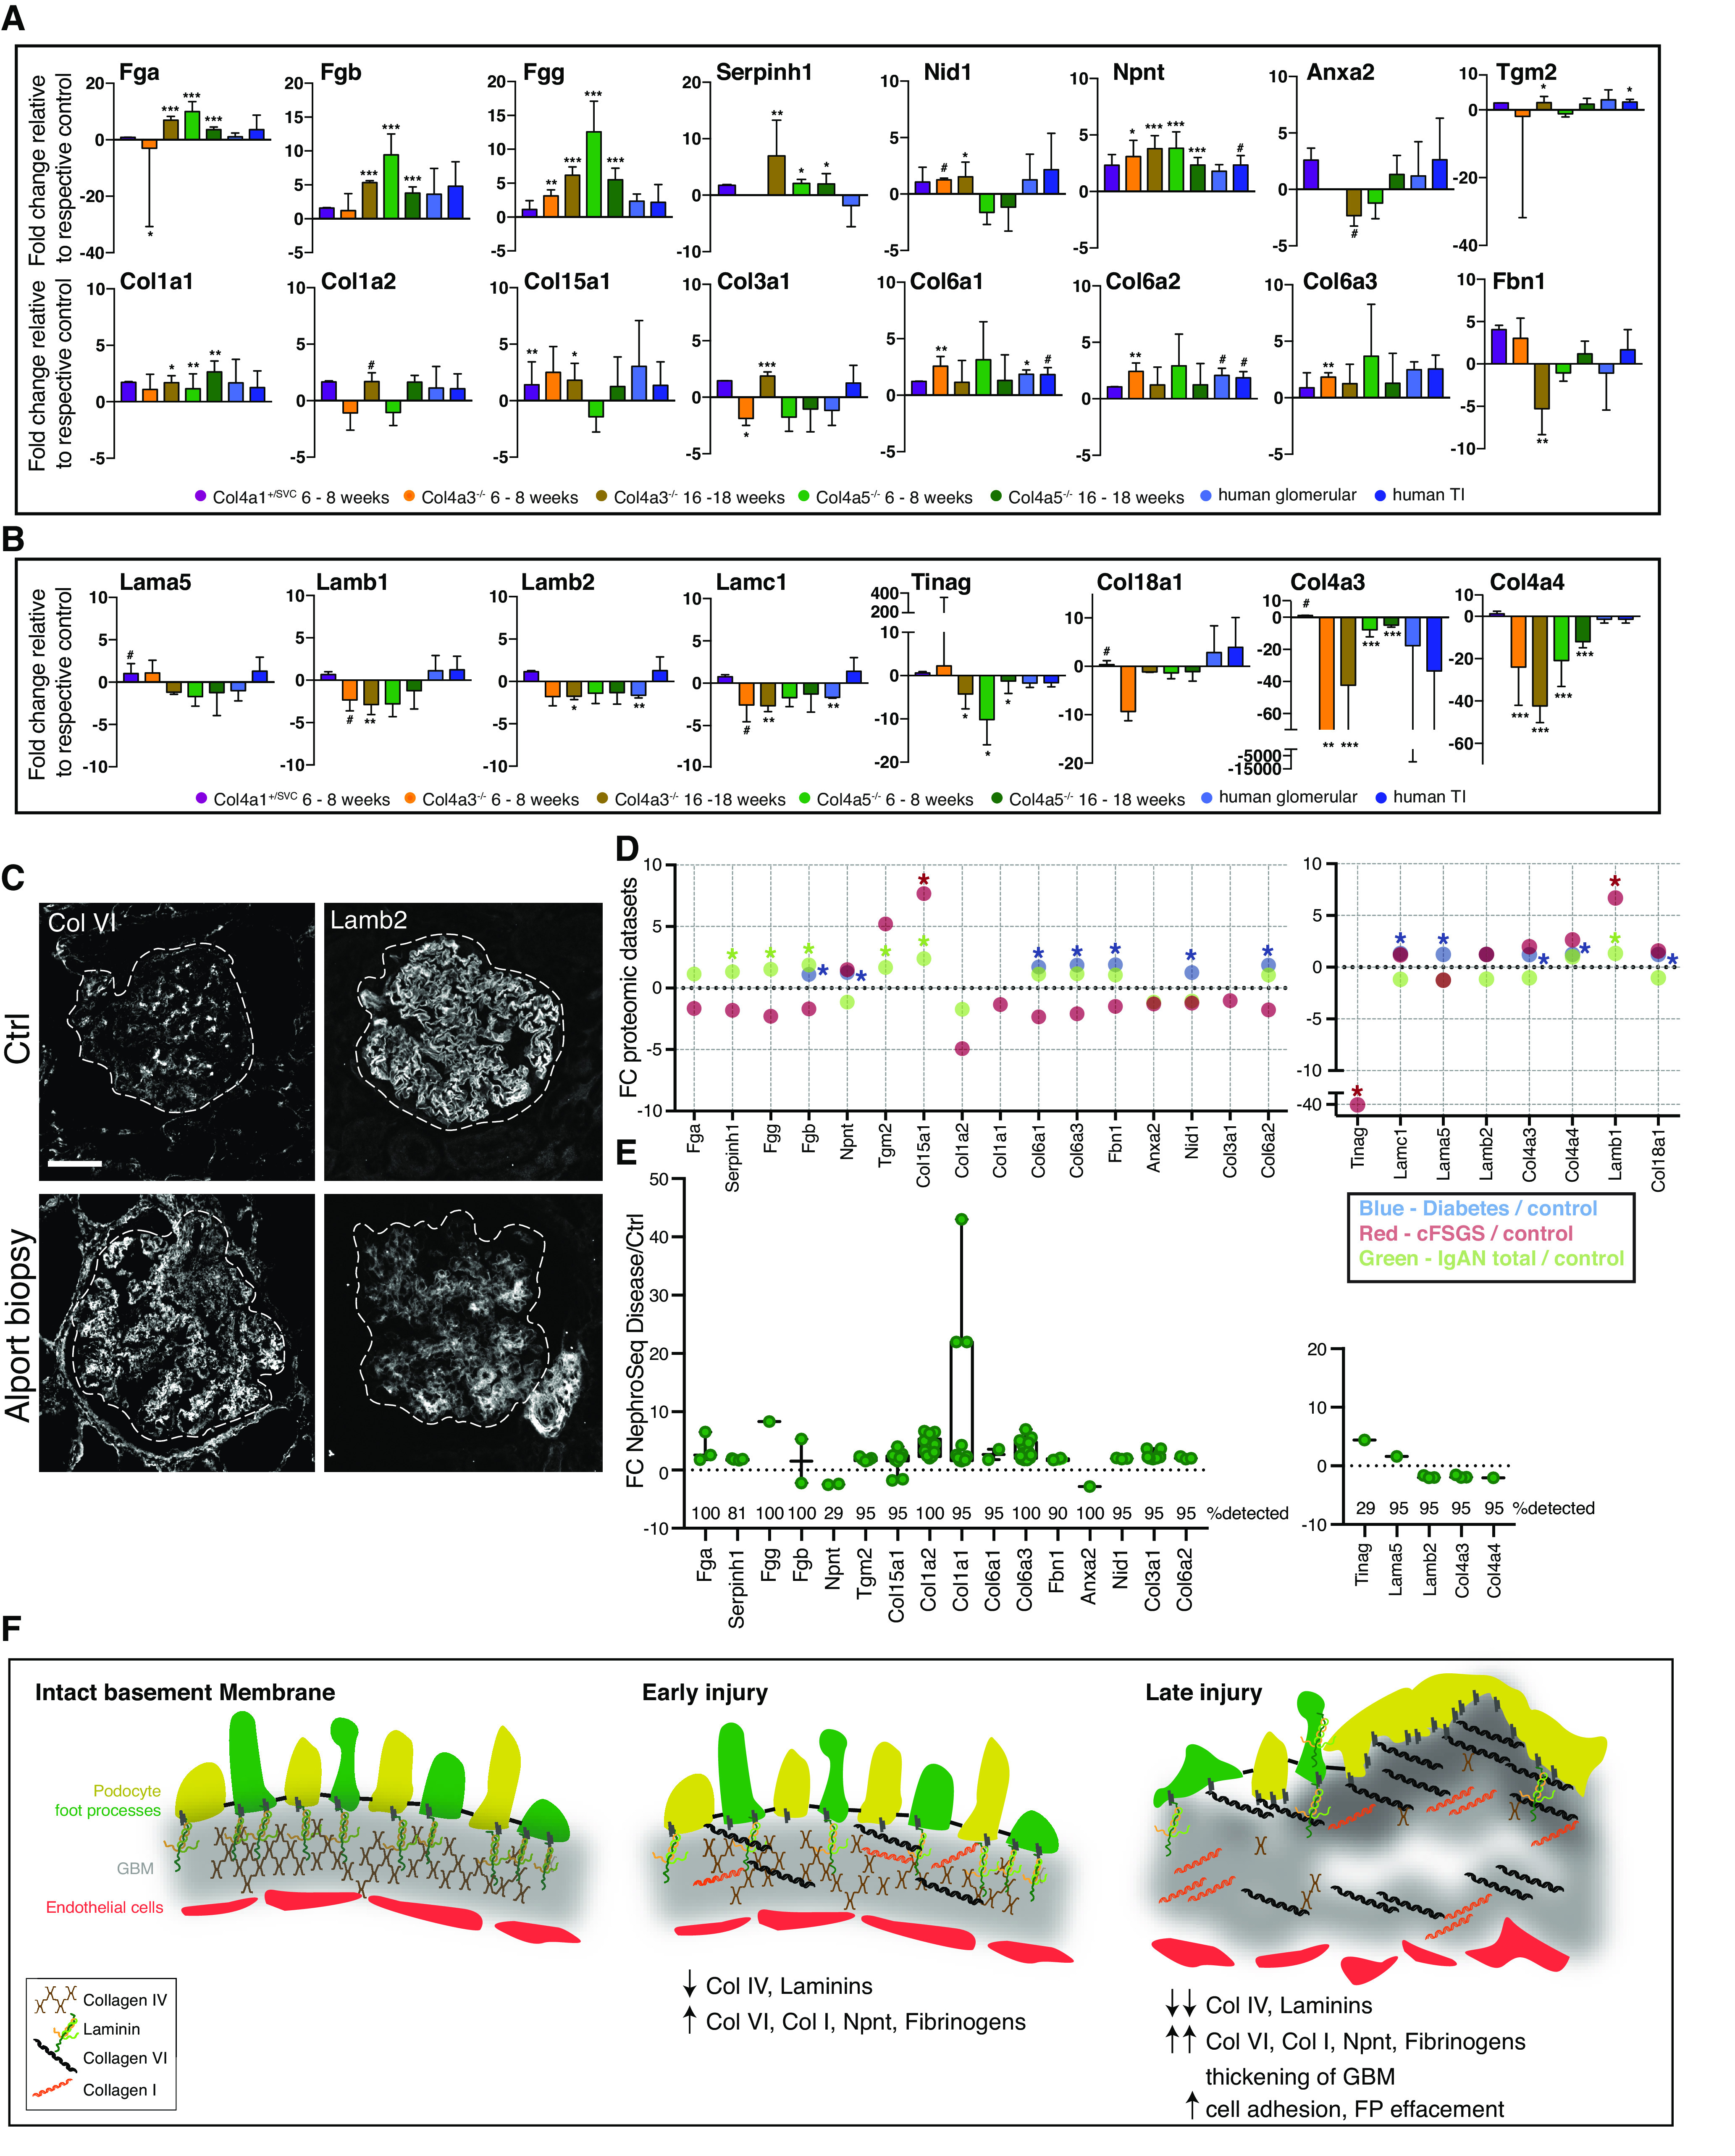
Figure 8.

Holistic analysis reveals a signature of altered kidney matrix in aging and disease. (A–B) Bar graphs displaying protein fold change of consistently altered matrix signature proteins relative to their respective controls. Error bars represent SD. #P<0.1, *P<0.05, **P<0.01, ***P<0.001. (A) Upregulated signature proteins. (B) Downregulated signature proteins. (C) Biopsy sections from a patient with autosomal recessive Alport syndrome and control (Ctrl) kidney tissue (nonaffected tissue of a tumor nephrectomy sample) Background was subtracted from immunofluorescence images using a rolling-ball algorithm in ImageJ.C were stained for type VI collagen (Col VI), laminin-β2 (Lamb2). Scale bar, 50 μm. (D) Dot plot comparison of signature matrix proteins to their protein levels in microdissected human IgA nephropathy (IgAN) samples (IgAN total and progressive IgAN),11 human diabetic samples,12 and human FSGS samples (collapsing FSGS [cFSGS] and FSGS not otherwise specified).42 Fold change (FC) is presented on the y axis and dataset is highlighted by color. *P<0.05. (E) Analysis of signature protein transcript levels in different disease datasets using the Nephroseq version 5 database. Glomerular datasets were extracted and altered transcript levels with fold change ±1.5 and P<0.05 are shown. The percentage detection of searched gene transcript is shown (number of datasets=21). Full details for Nephroseq datasets and transcript fold changes used for each signature gene can be found in Supplemental Table 3. (F) Schematic of hypothesized BM injury process. FP, foot process.
