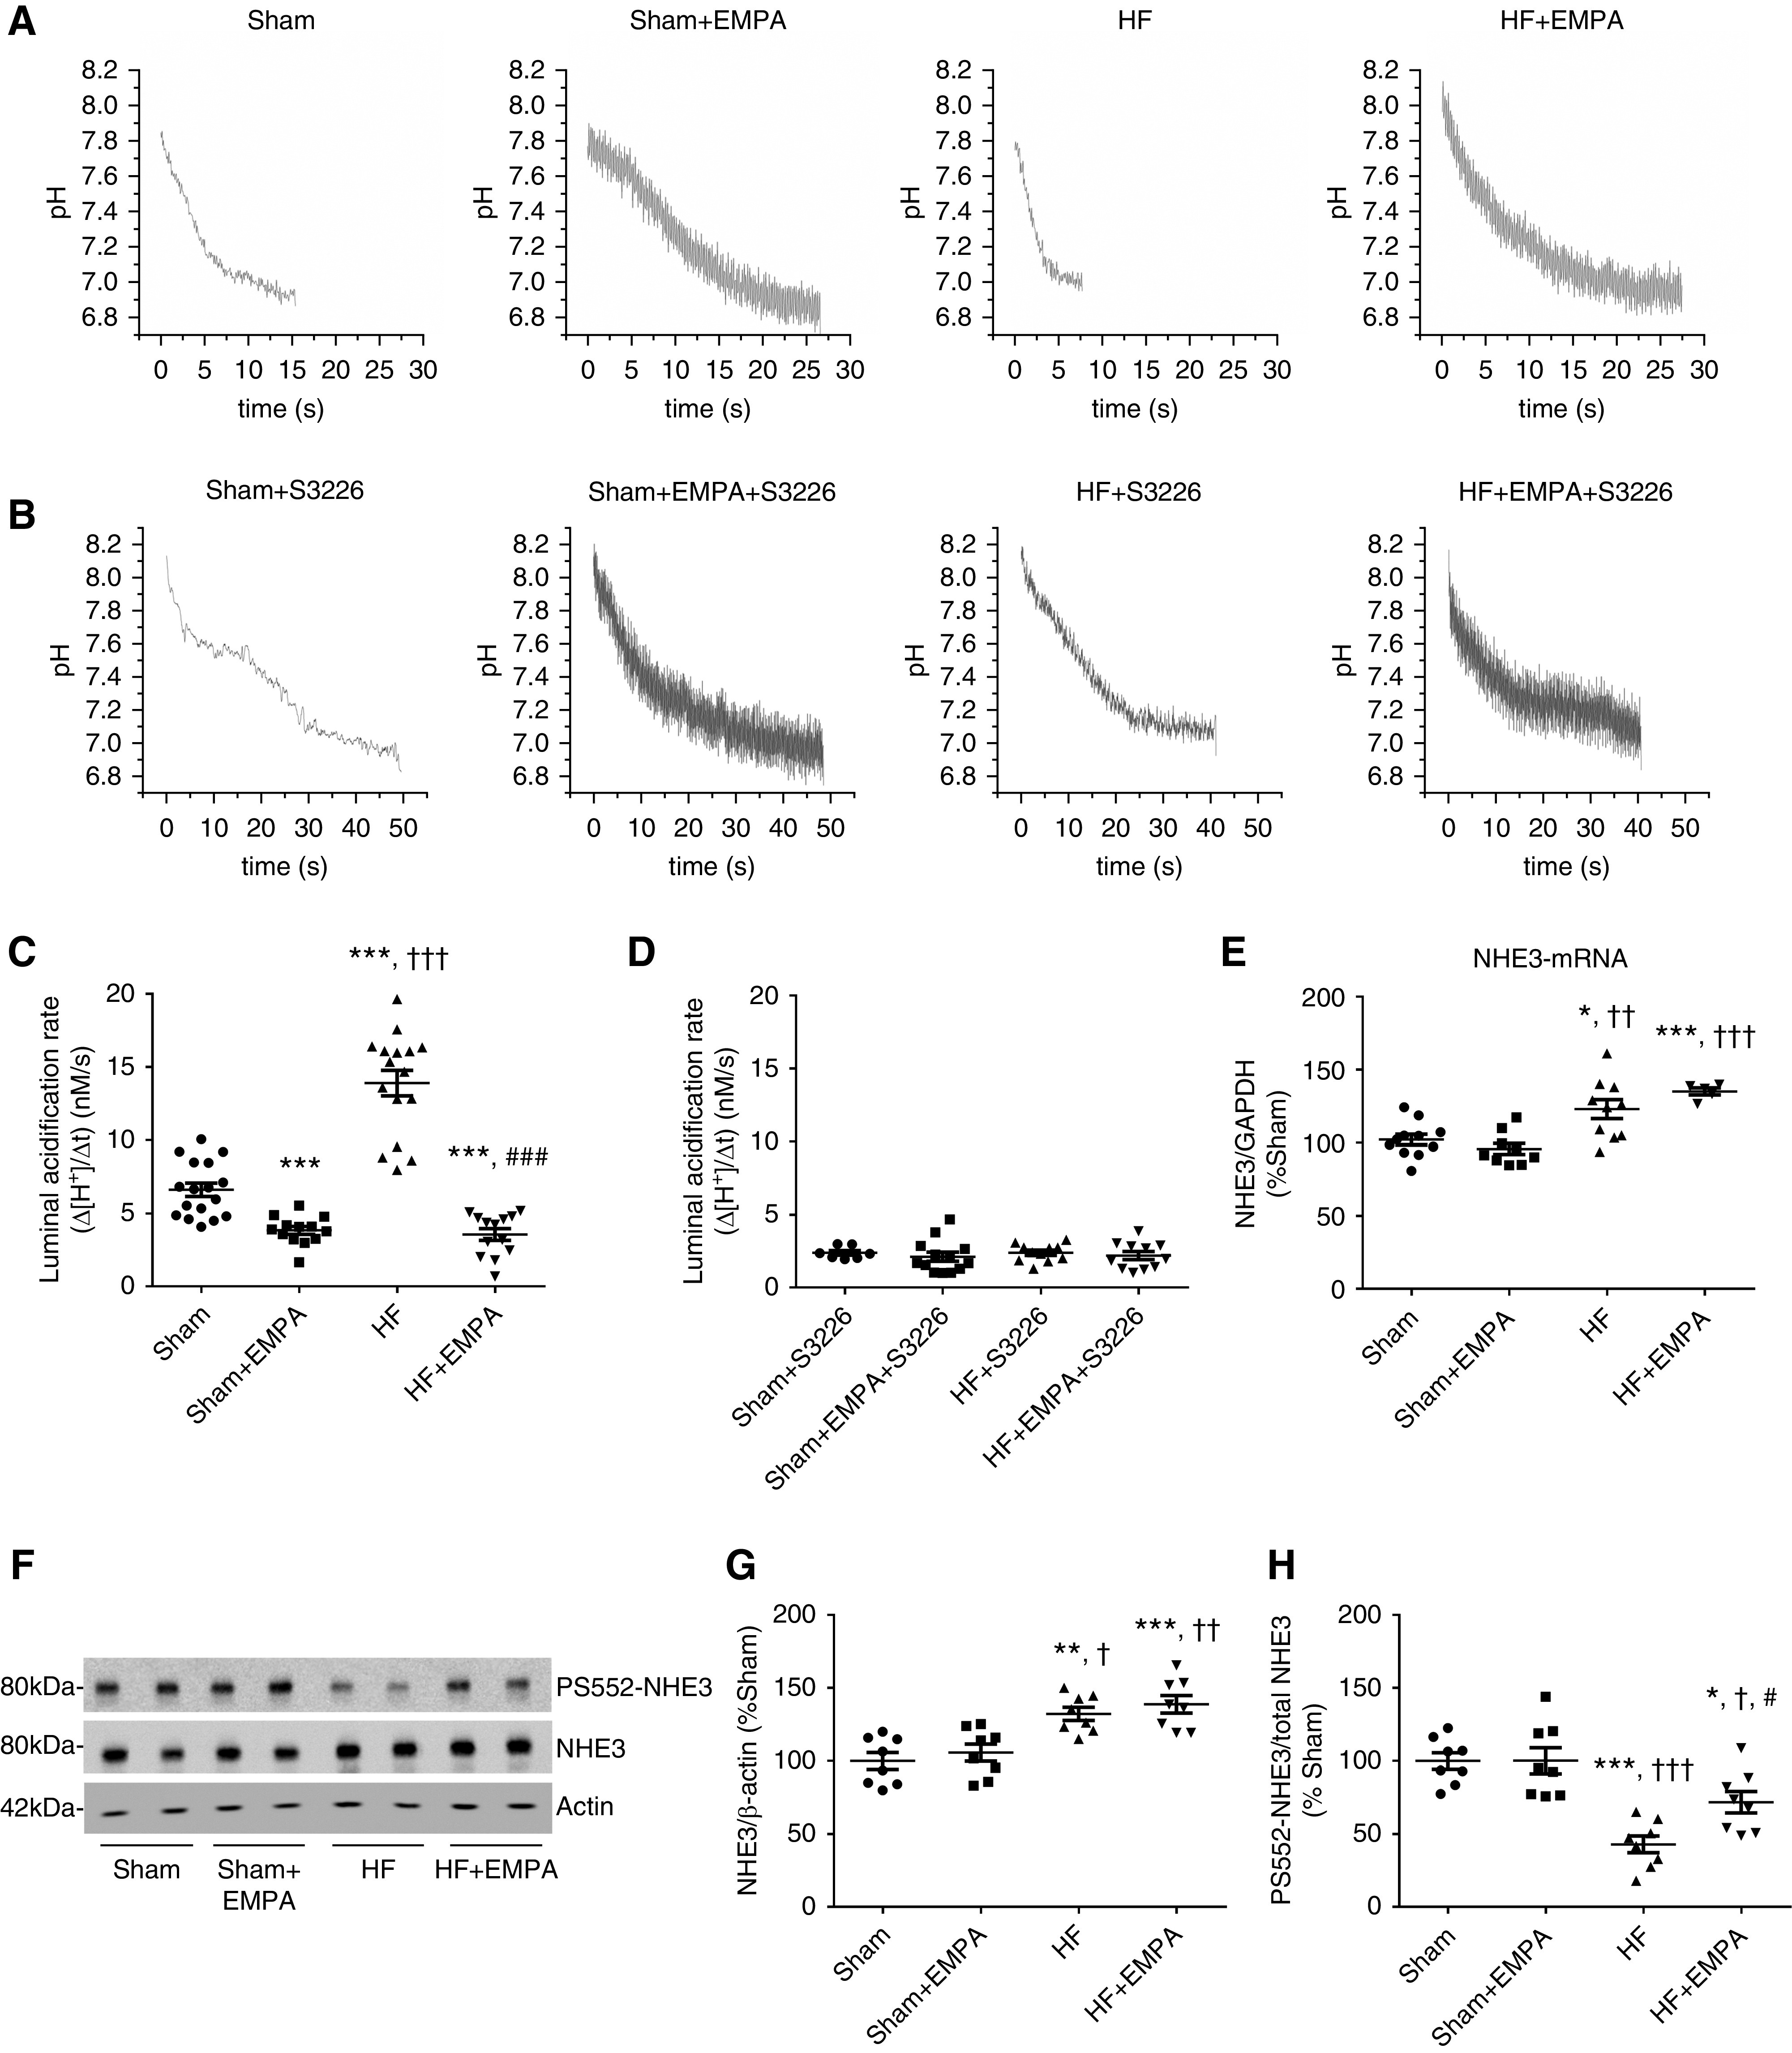
Figure 7.

Treatment with empagliflozin (EMPA) inhibits PT NHE3 activity. (A–D) Modulation of NHE3 activity by EMPA was determined by assessing the PT luminal acidification in the presence or absence of 10 µM S3226, a selective inhibitor of NHE3. (A and C) Representative luminal pH recordings and the rate of luminal acidification in sham and HF rats treated with EMPA or untreated in the absence of S3226. (B and D) Representative luminal pH recordings and the rate of luminal acidification in sham and HF rats treated with EMPA or untreated in the presence of S3226. (E) Graphic representation of the relative mRNA expression of NHE3 in the renal cortex of sham and HF rats treated with EMPA or untreated. The levels of NHE3 mRNA were measured using quantitative PCR, and GAPDH (glyceraldehyde 3-phosphate dehydrogenase) was used as an internal control. (F) Renal cortical proteins isolated from the four groups of rats were resolved by SDS-PAGE and transferred to polyvinylidene difluoride membranes. The membranes were probed with a primary antibody against total NHE3, a phosphospecific antibody that recognizes NHE3 only when it is phosphorylated at serine 552 (PS552-NHE3), and an antibody against β-actin as an internal control. (G) Graphic representation of the relative expression of total NHE3 and (H) the ratio of phosphorylated NHE3 at serine 552 to total NHE3 (PS552-NHE3/total NHE3). The values represent individual measurements and the means ± SEM (Supplemental Material). *P=-0.02 versus sham; **P=0.002 versus sham; ***P<0.001 versus sham; † P=0.02 versus sham + EMPA; †† P=0.001 versus sham + EMPA; ††† P<0.001 versus sham + EMPA; # P=0.03 versus HF; ### P<0.001 versus HF.
