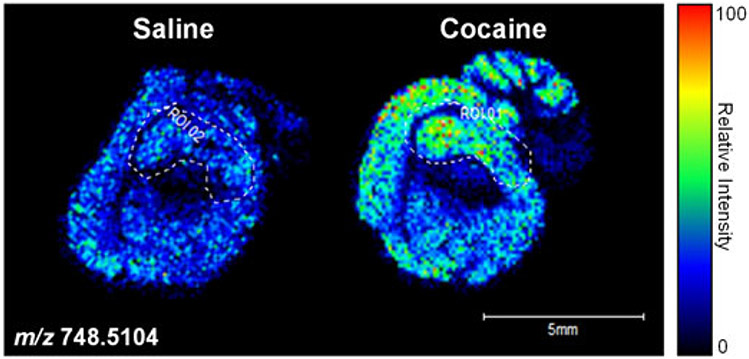
Figure 6.
MALDI-FTICR-MS relative expression and distribution of phospholipid species (m/z 748.5104). MALDI-FTICR-MS was performed on adult mouse sagittal brain sections acquired in the negative ion mode. Left panel: saline-treated; Right panel: cocaine-treated. The color scale to the right of the panel represents the relative intensity normalized to total ion count. Scale bar: 5 mm.

