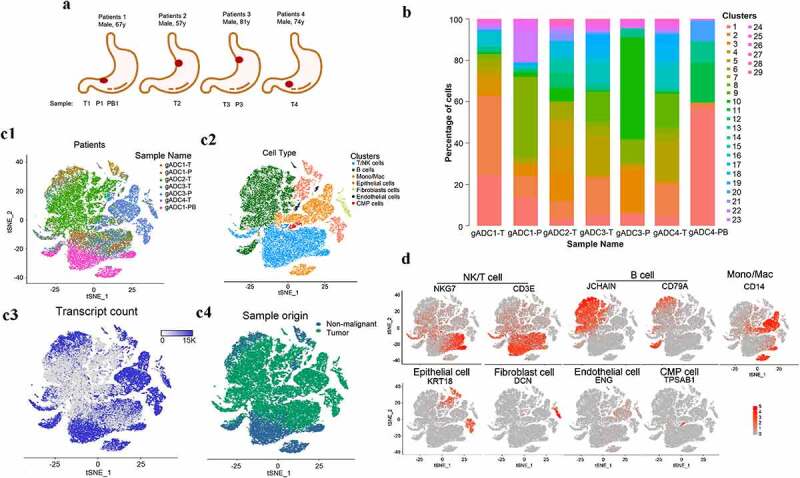
Figure 1.

Overview of profiling of 49,765 single-cells from tumor and non-tumor of gastric adenocarcinoma (gADC) tissues
(a) Summary of sample origins. T: tumor sample; P: para-carcinoma sample; PB: peripheral blood. (b) Distribution of 29 cell-clusters assigned from 49,765 single cells in seven tissue samples. (c) t-distributed stochastic neighbor embedding (tSNE) of the 49,765 cells profiled here, with each cell color-coded for: the corresponding patient (c1), the associated cell type (c2), the number of transcripts (UMIs) (c3), and its sample type of origin (tumor or nonmalignant tissue) (c4) (log scale as defined in the inset). (d) tSNE of the expression levels of marker genes for each cell type.
