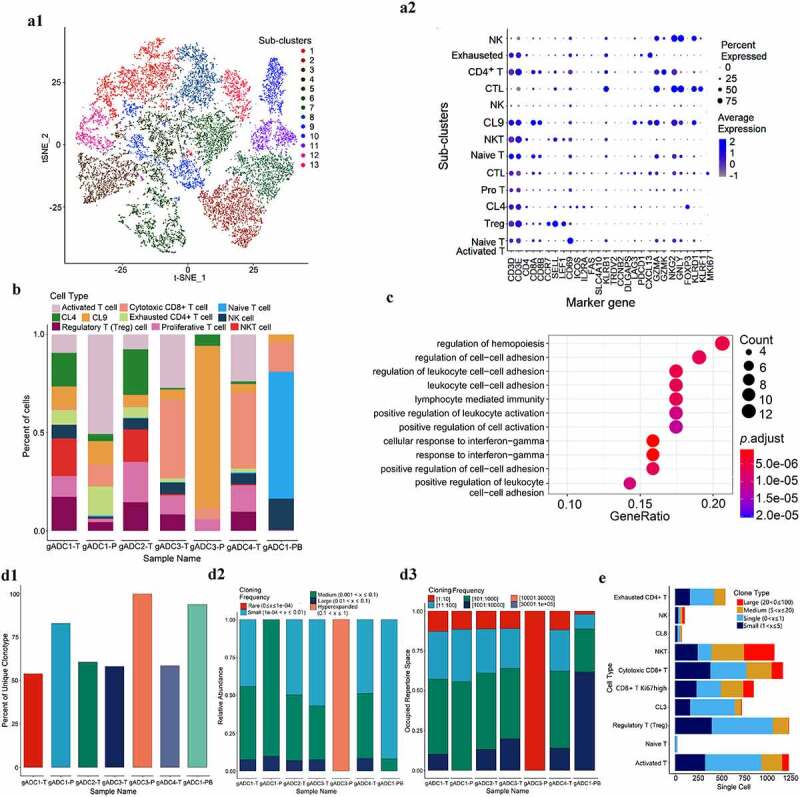
Figure 3.

Dissection and subclusters of T cells in gastric adenocarcinoma (gADC)
(a) t-distributed stochastic neighbor embedding (tSNE) of 16, 233 T cells profiled here, with each cell color-coded and redefined into 13 subclusters (a1); Dotplot of marker gene in 13 separate T cell subsets (a2). (b) Distribution of 10 cell types in seven tissue samples through a computational method for unbiased cell-type recognition. (c) Dotplot showing gene oncology (GO) and Gene set enrichment (GSEA) analysis of the pathway difference between the NK/T cell and cytotoxic CD8 T (CTL) cells (P < .001). (d) Left to right: T cell receptor (TCR) unique clone type (d1), abundance (d2) and the proportion of cloning frequency (d3) in seven tissue samples. (e) t-SNE of the top two highest amplified TCR_clone types of NKT and CTL cells.
