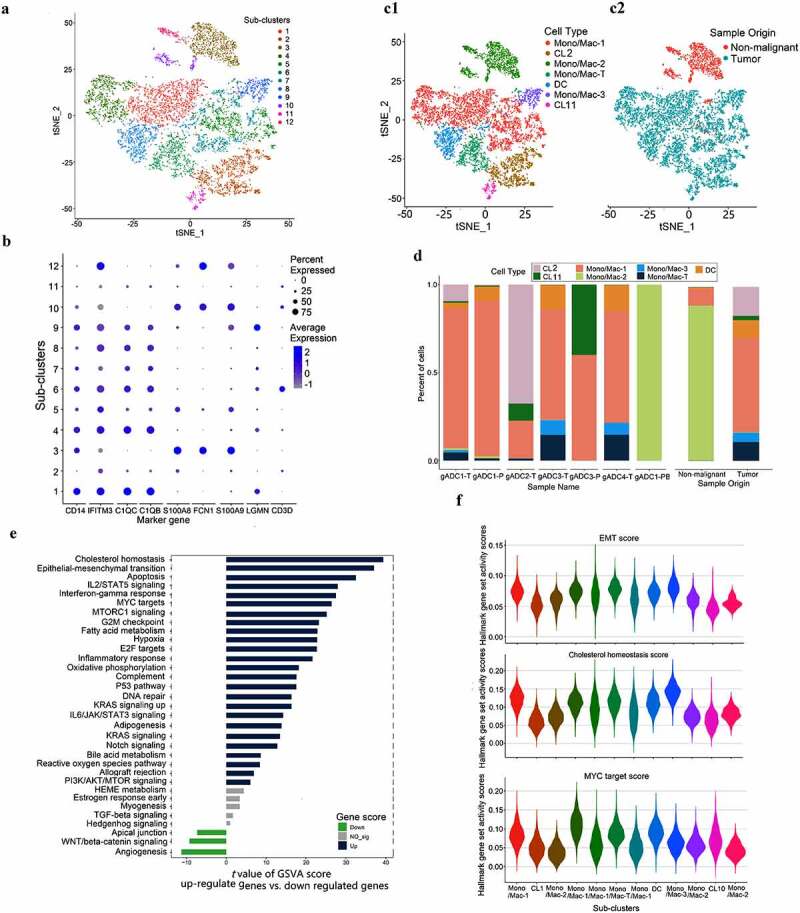
Figure 4.

Dissection and subclusters of Monocytes/Macrophages in gastric adenocarcinoma (gADC)
(a) t-distributed stochastic neighbor embedding (tSNE) of 8,682 Monocytes/Macrophages (Mono/Mac) cells re-clustered in 12 separate subclusters. (b) Dotplot showing marker gene in seven cell types. (c) tSNE of Mono/Mac cells, with each cell color-coded and redefined into the associated cell type (c1) and its sample type of origin (tumor or nonmalignant tissue) (c2) (log scale as defined in the inset). (d) Distribution of seven cell types in seven tissue samples, and in tumor sample compared with non-tumor sample. (e) Gene set variation analysis (GSVA) analysis was performed based on Mono/Mac cells from the origin of malignant and nonmalignant cells. The GSVA data are plotted according to the t value of Limma, and t > 5 is considered have significance. (f) Violin displaying the hall-marker distribution of the epithelial mesenchymal transition, cholesterol homeostasis, and Myc across all Mono/Mac cells.
