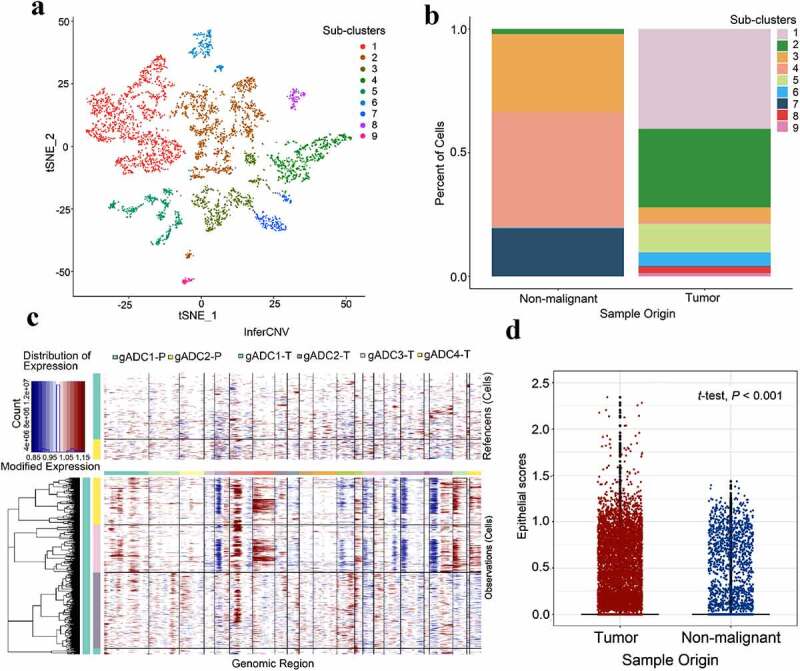
Figure 5.

Classification of malignant and nonmalignant epithelium cells
(a) t-distributed stochastic neighbor embedding (tSNE) of 5,036 epithelial cells re-clustered into nine separate subclusters (log scale as defined in the inset). (b) Distribution of nine separate subclusters between malignant and nonmalignant samples. (c) Heatmap showing large-scale CNV (chromosome copy number variation) for individual cells (rows) from tumor samples and non-tumor samples, inferred based on the average expression of 100 genes surrounding each chromosomal position (columns). Red: amplifications; blue: deletions. (d) Histogram showing distributions of epithelial scores (average expression of epithelial marker genes) for cells categorized as malignant or nonmalignant (t-test, P < 2.2 × 10 −16).
