
Fig. 2. Tumor cell expression of αvβ8 drove a distinct immunosuppressive Tregtranscriptome.
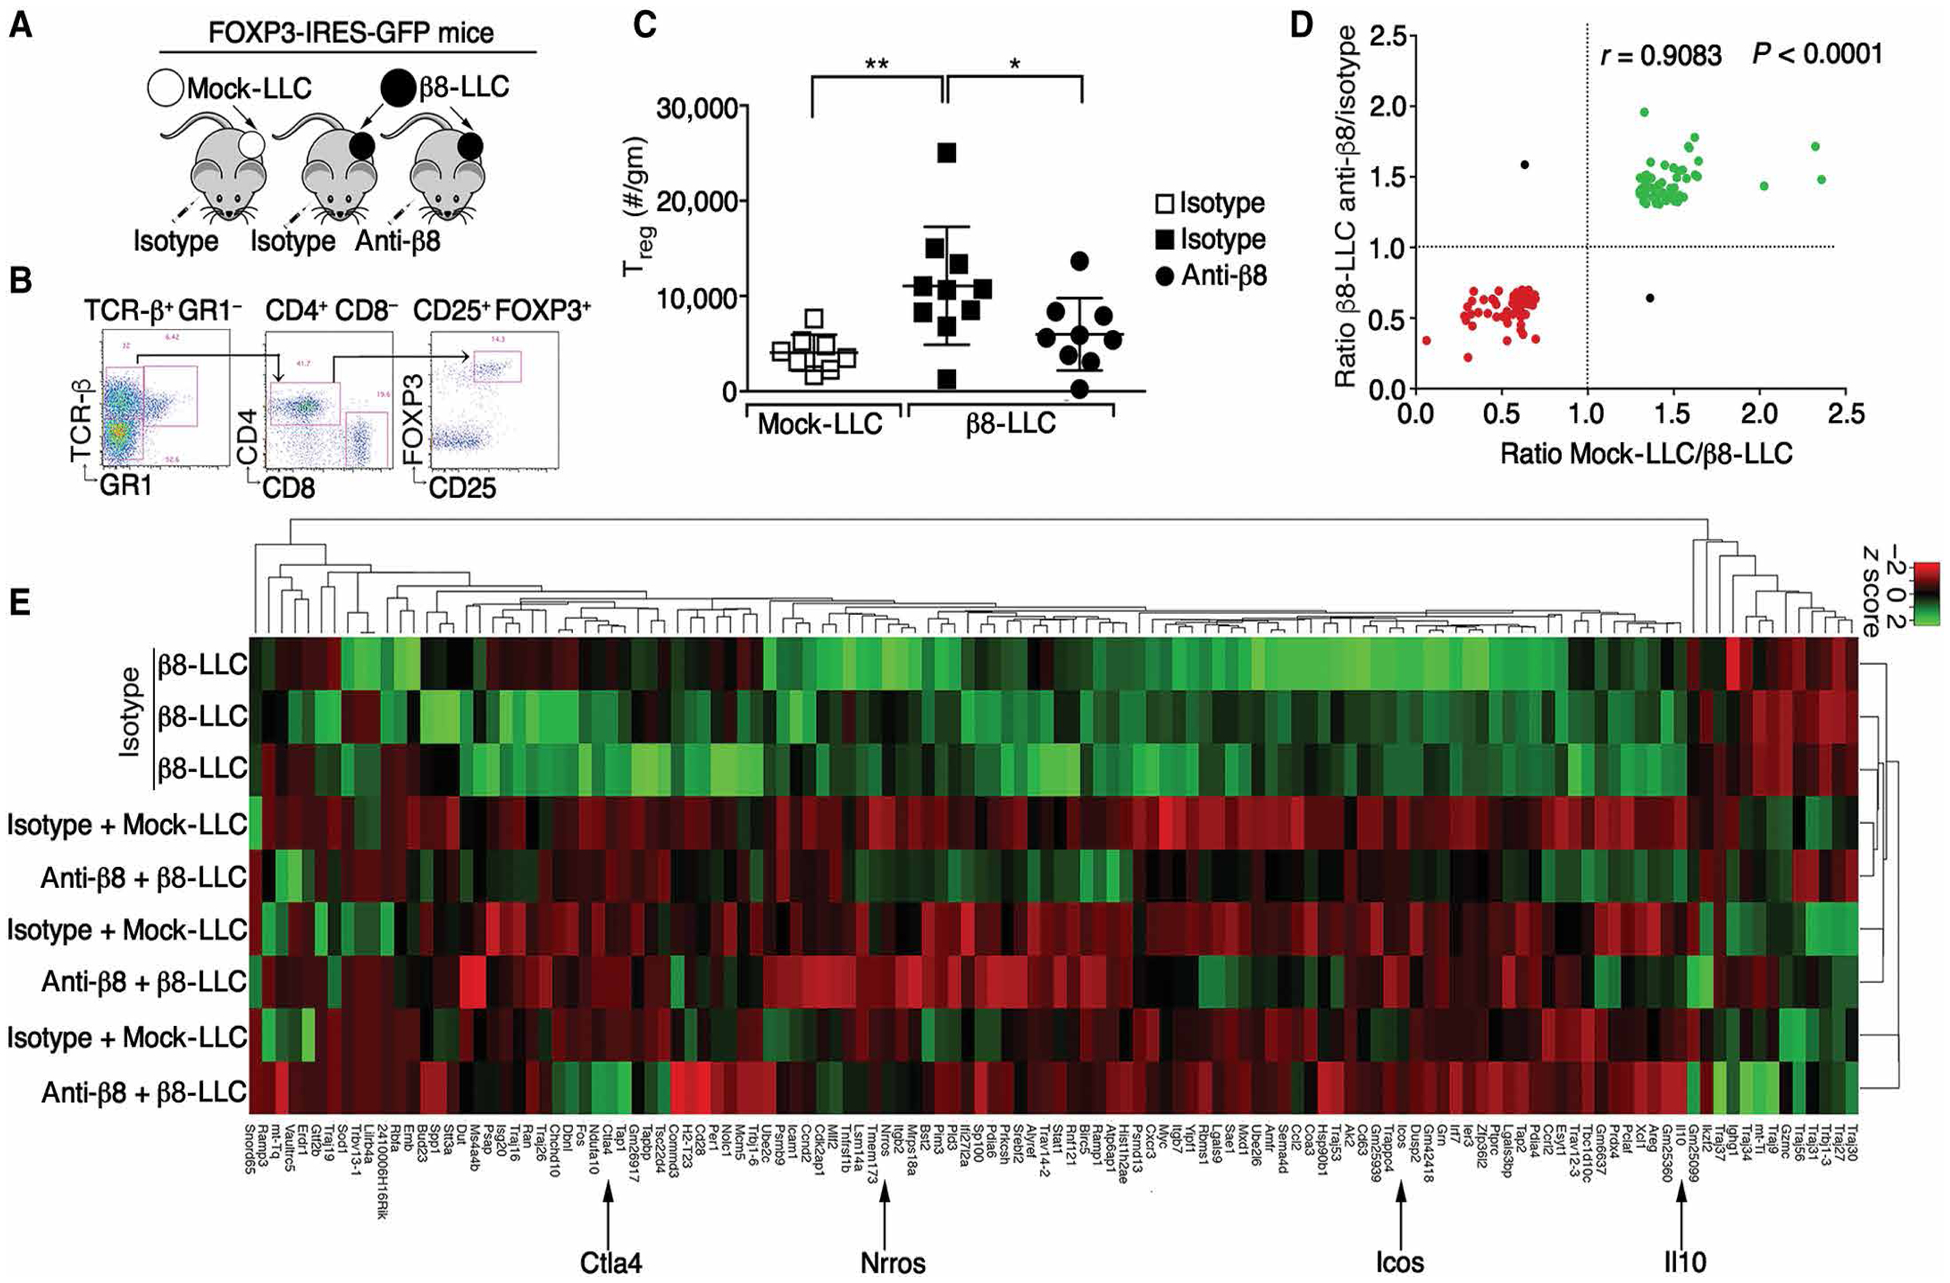
(A) Cartoon of model. (B) Gating strategy for FOXP3+CD25+ cells, enumerated in (C) as FOXP3+CD25+ cells/g (outliers removed) of mock (open boxes) or β8-LLC tumors treated with isotype (filled boxes) or anti-β8 (C6D4, filled circles). (D) Bulk RNAseq of sorted pools (9 to 10 mice per group in three pools) of CD4+GFP+ cells. Differential expression plot of 118 most highly expressed genes [>50 average fragments per kilobase million (FKPM)] increased (green) or decreased (red) in expression by at least 30% in Treg groups treated with anti-β8 compared with isotype control or mock-LLC compared with β8-LLC, with Pearson R and two tailed P value. (E) Hierarchal clustering and heatmap of 118 most highly and variably expressed genes shown in (D). Note that Tregs from β8-LLC isotype–treated tumors are distinct (top three rows) from mock or β8-LLC Treg treated with anti-β8 (C6D4). Arrows indicate key genes. For multiple comparisons, one-way ANOVA was used followed by Tukey’s post-test. *P < 0.05 and **P < 0.01.