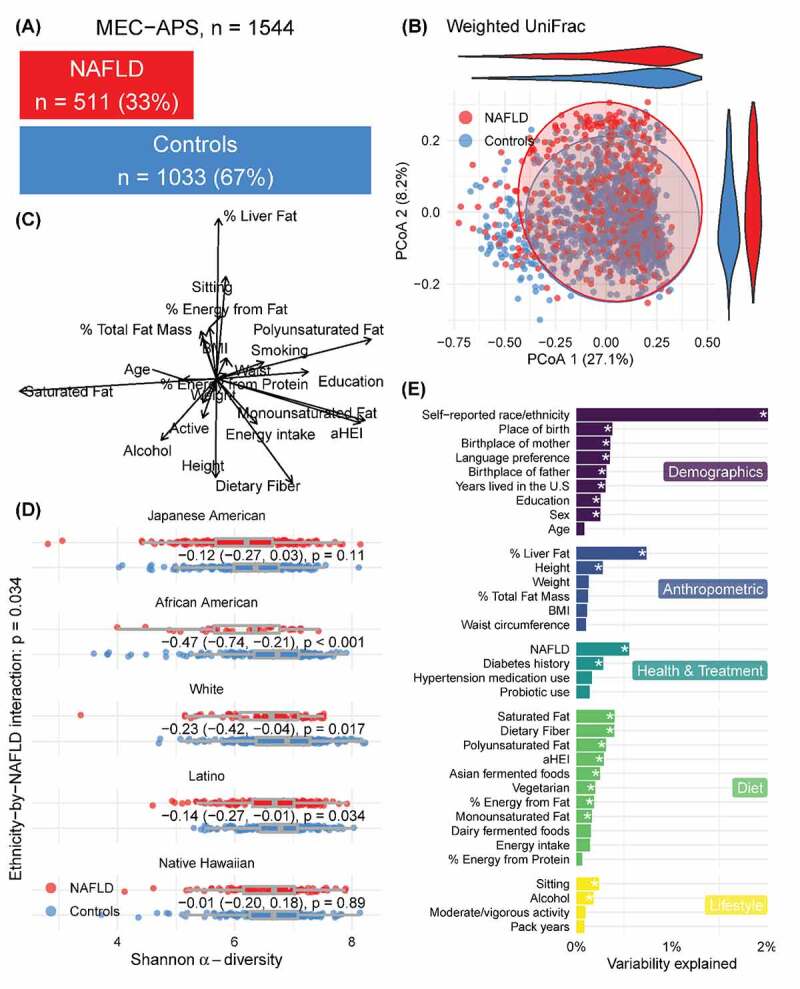
Figure 1.

Overview of the microbiome in NAFLD in the MEC-APS study. 1A.) Distribution of individuals with and without NAFLD. 1B.) Variation in the microbiome between individuals with and without NAFLD illustrated by a PCOA of weighted Unifrac metric. 1 C.) Vector overlay of the demographic, anthropometric, health, diet, and lifestyle variables. 1D.) Alpha diversity in subjects with and without NAFLD by ethnicity and 1E.) Variation in the microbiome explained by the demographic anthropometric, health, diet, and lifestyle variables using perMANOVA analysis
