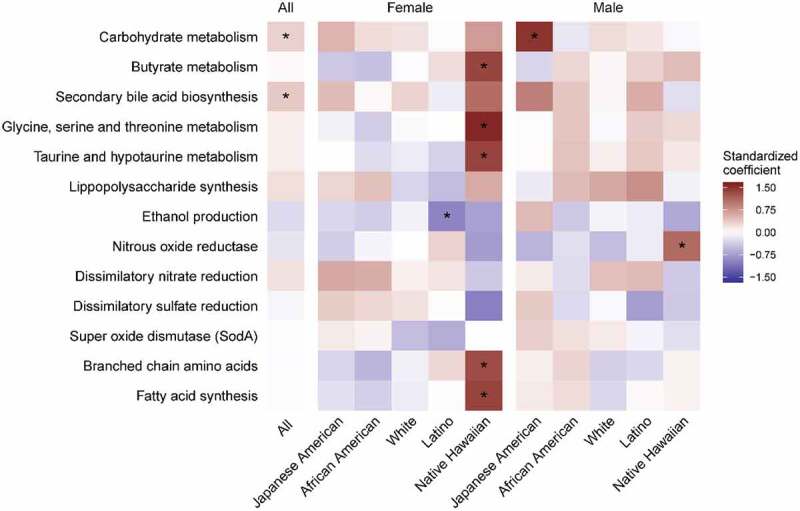
Figure 3.

Heatmap of the association between imputed microbial functional pathways with percent liver fat by sex and ethnicity in the MEC-APS (n = 1529). The colors represent the magnitude of the pathway standardized coefficient in the linear model of the natural log of percent liver fat on each pathway, adjusted for sex, ethnicity, total fat mass, and sequencing batch. The gene counts were inferred from piCRUST and pathways summarized by summing all counts in the pathway and then normalized for the total number of sequences per sample, which were then standardized for the model. Asterisks indicate a BH corrected p value less than 0.1. (Also see Supplemental Table 5.)
