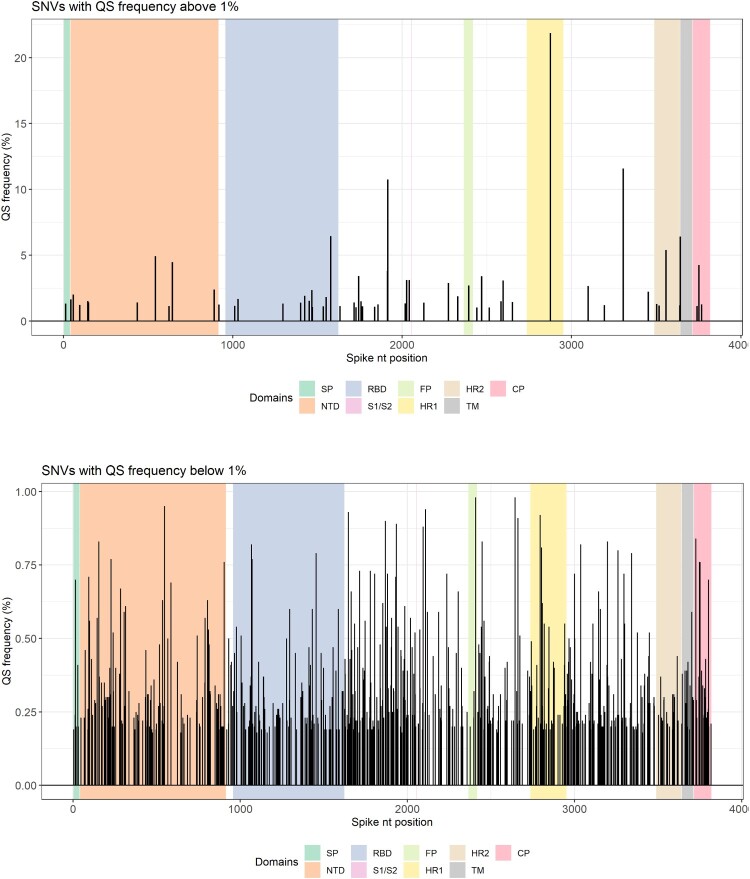
Figure 1.
Single nucleotide variants (SNVs) according to their frequency and position in the spike (S) region. Top panel shows SNVs with frequencies above 1%. Bottom panel shows SNVs below 1%. The spike regions are depicted in different background colours. CP, cytoplasmic domain; FP, fusion peptide; HR, heptad repeat; NTD, N-terminal domain; QS, quasispecies; RBD, receptor-binding domain; SP, signal peptide; TM, transmembrane.

