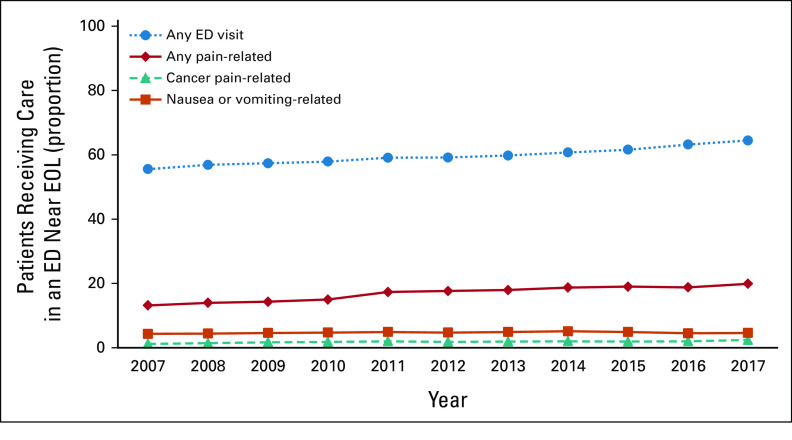
FIG 4.
Annual trends in the proportion of patients with poor prognosis cancers receiving care in an ED near the EOL overall, and for pain. The blue line represents annual trends in the proportion of patients having ≥ 1 ED visit near EOL; the red line represents trends in the proportion of patients having ≥ 1 ED visit for pain near EOL using the CMS OP-35 definition; the green line represents trends in the proportion of patients having ≥ 1 ED visit with an International Classification of Diseases Ninth Revision or Tenth Revision code for malignancy associated pain near EOL; the purple line represents trends in the proportion of patients having ≥ 1 ED visit for nausea or vomiting near EOL using the CMS OP-35 definition. Outcomes were examined in the last 30 days before death or hospice enrollment. CMS, Centers for Medicare & Medicaid Services; ED, emergency department; EOL, end-of-life.

