Figure 2.

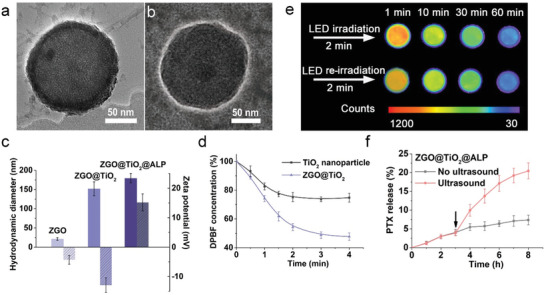
Characterization of ZGO@TiO2@APL. TEM image of a) ZGO@TiO2 and b) ZGO@TiO2@ALP. c) Size distribution and zeta potential of ZGO, ZGO@TiO2, and ZGO@TiO2@ALP. d) Time‐dependent ROS generation ability of ZGO@TiO2 under US irradiation (5 min, 1.5 MHz, 1.5 Wcm−2). e) Persistent luminescence image of ZGO@TiO2@ALP aqueous solution (100 µL, 0.3 mg mL−1). Persistent luminescence was activated following a 2 min red LED excitation (650 ± 10 nm) before imaging, and the signal acquisition time was set to be 120 s under the imaging system. f) In vitro PTX release from ZGO@TiO2@ALP with and without ultrasound irradiation. The arrows represent the application of ultrasound (5 min, 1.5 MHz, 1.5 W cm−2). Data are given as mean ± s.d. (n = 4).
