
Figure 1.
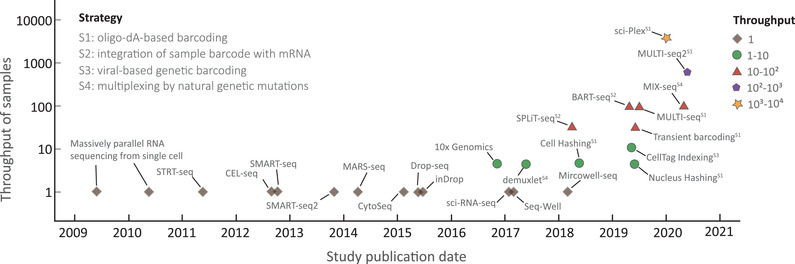
Sample throughput of representative scRNA‐seq methods. The approaches are denoted by five shapes, according to the number of samples analyzed in the study, as shown in the figure key. S1‐4 respectively represents the strategy corresponding to each barcoding approach, namely, S1: Oligo‐dA‐based barcoding; S2: Integration of sample barcode with mRNA; S3: Viral‐based genetic barcoding; S4: Multiplexing by natural genetic mutations.