
Figure 2.
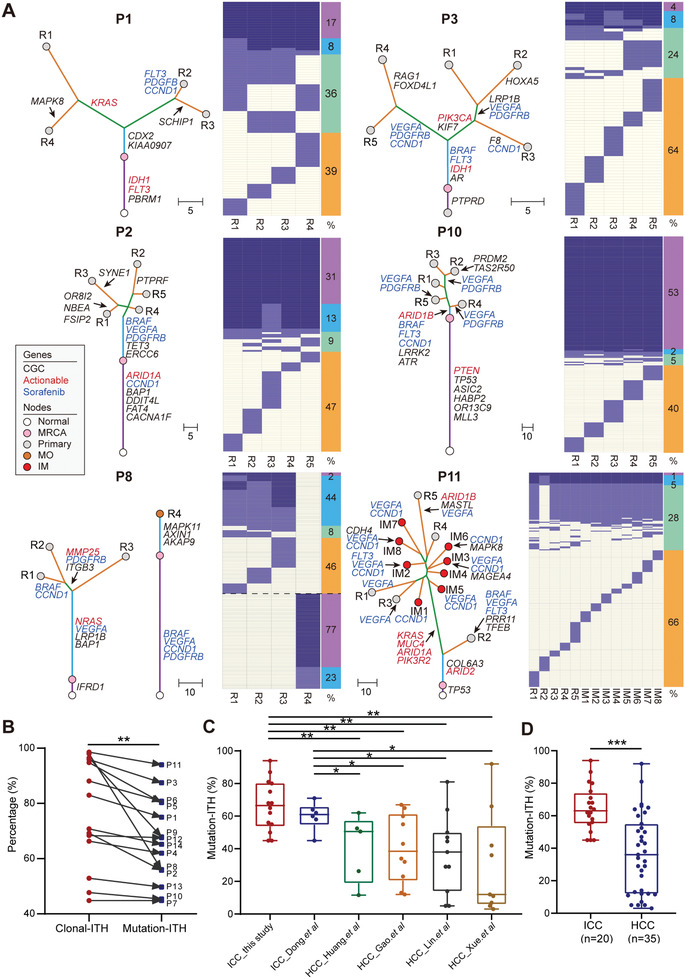
Extensive ITH in ICC observed on the DNA level. A) Heatmaps show the regional distribution of all mutations in six selected patients. Clonal and subclonal mutations are marked in blue and light blue, respectively. The columns next to each heatmap show four categories of mutations and their percentages: trunk clonal mutations (purple); trunk subclonal mutations (sky blue); branch mutations (pale green); and region‐specific mutations (orange). Phylogenetic trees were constructed using a maximum parsimony algorithm based on mutations identified in each patient. The length of each line is proportional to the number of mutations. Mutations in potential driver genes are indicated, including CGC genes (black) and actionable genes (red). Sorafenib‐targeted amplifications are annotated in blue. Patient IDs and region names are labeled in each tree. MRCA, most recent ancestor, IM, intrahepatic metastasis, MO, multiple occurrences. B) Comparison of clonal ITH and mutation‐ITH. ** P < 0.01, paired Student's t test. C) Comparison of mutation‐ITH between ICC and HCC studies. In the box plots, the lines in the box indicate the median, the boxes indicate the first and third quartiles. * P < 0.05, ** P < 0.01, Student's t test. D) Comparison of the pooled mutation‐ITH of ICC and HCC studies. *** P < 0.001, Student's t test.