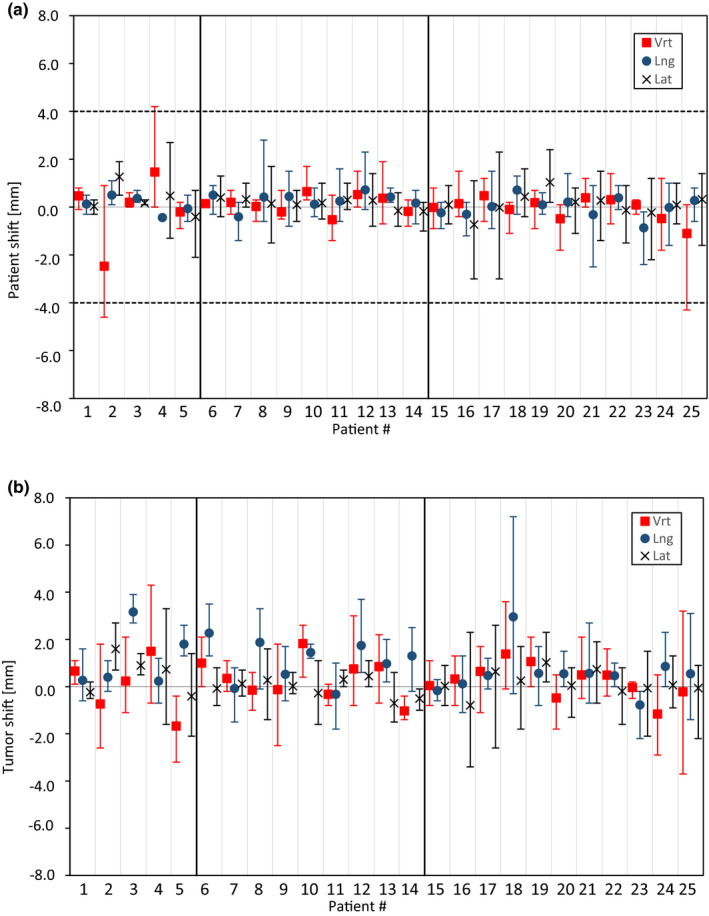
FIGURE 2.

Intra‐fractional shifts of the patients (a) and the tumors (b) for each individual patient in the vertical (vrt), longitudinal (lng), and lateral (lat) directions. The points represent the mean values for all fractions and the whiskers show the maximum values. The dotted line in figure A represents the isocenter deviation tolerance used (4 mm) for motion monitoring with the surface guidance system
