
FIGURE 3.
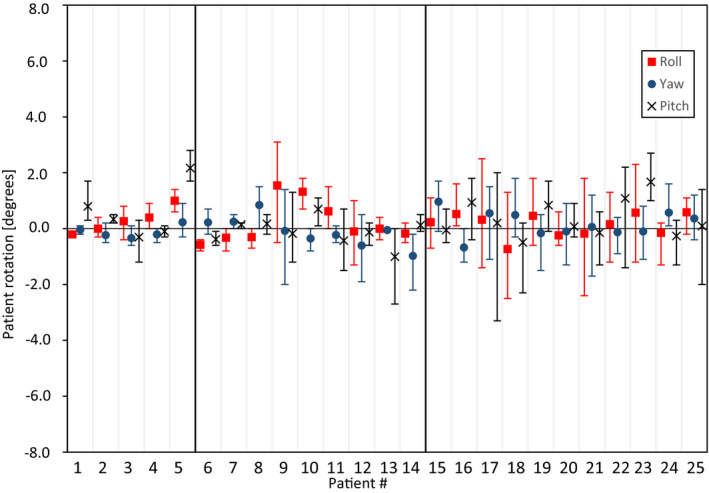
Intra‐fractional patient rotations for each individual patient based on CBCT registrations performed before and after each treatment fraction. The points represent the mean values for all fractions and the whiskers show the maximum values
Official websites use .gov
A
.gov website belongs to an official
government organization in the United States.
Secure .gov websites use HTTPS
A lock (
) or https:// means you've safely
connected to the .gov website. Share sensitive
information only on official, secure websites.
Intra‐fractional patient rotations for each individual patient based on CBCT registrations performed before and after each treatment fraction. The points represent the mean values for all fractions and the whiskers show the maximum values