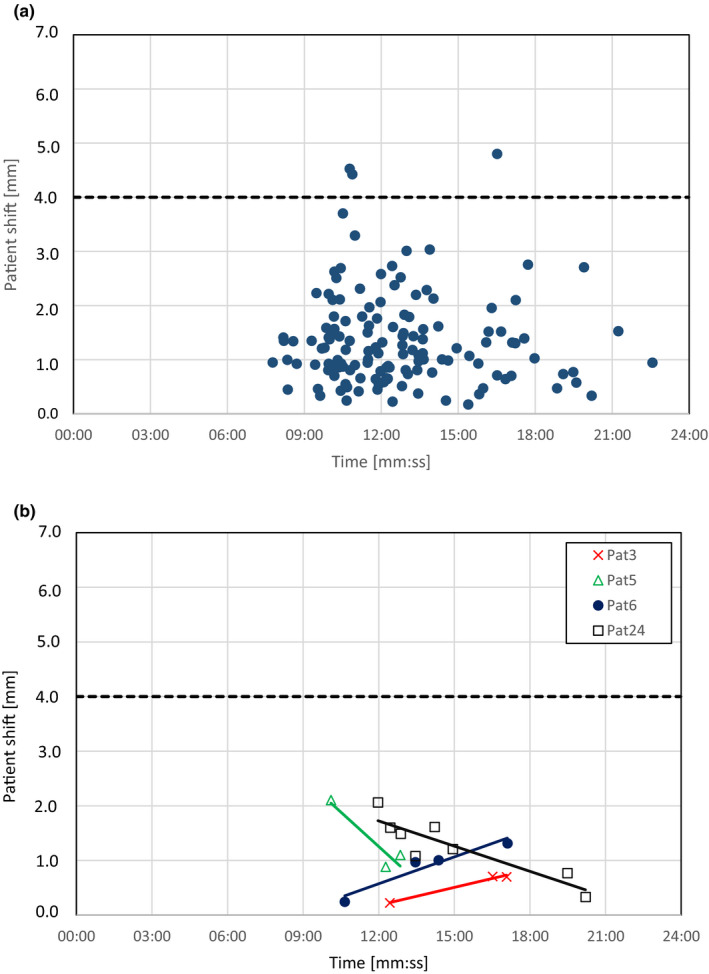
FIGURE 4.

Magnitude of the observed intra‐fractional shift of the patient vs the registered time between CBCTpre‐start and CBCTend for all the 137 fractions that were evaluated (a) and for the individual patients with correlation coefficients ≥0.800 (b). A linear fit for all the patients in figure A shows a R 2‐value of 0.0023. In figure B, patient 3 and 6 have an increased patient shift with increased treatment time while patient 5 and 24 have a decreased patient shift with treatment time. The solid lines show the linear fits for the points and the dotted lines represents the isocenter tolerance used (4 mm) for patient monitoring with the surface guidance system
