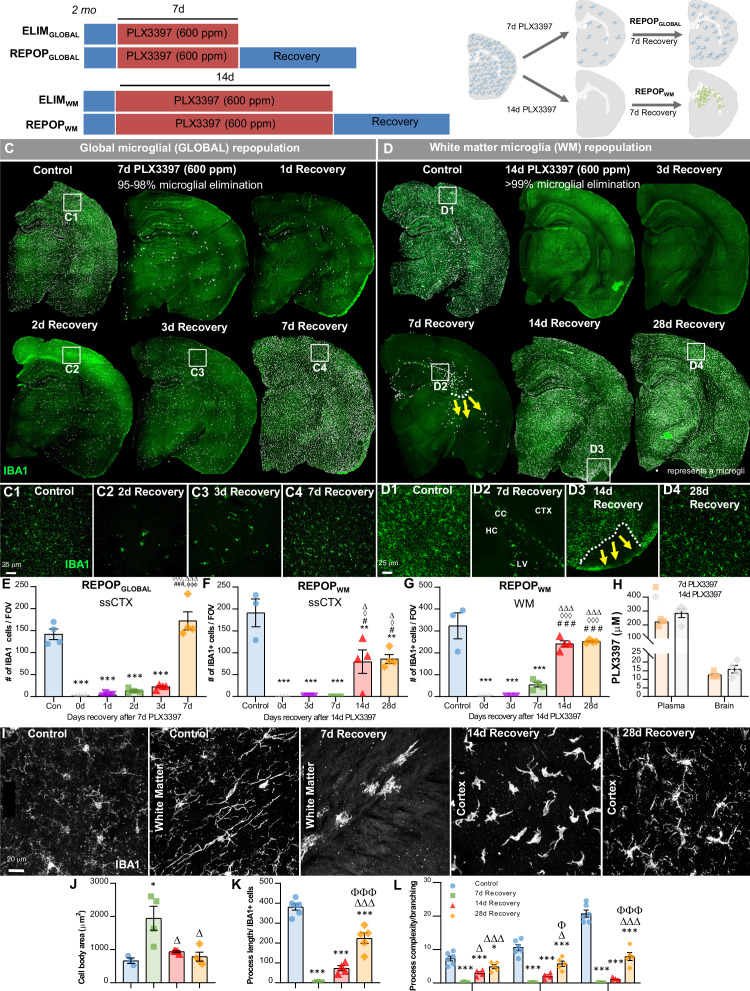
Figure 1. Sustained high dose of CSF1R inhibitor unmasks a distinct form of myeloid cell CNS repopulation.
(A–B) Experimental paradigm and schematic depicting dose and duration of PLX3397 (600 ppm) treatment and subsequent inhibitor withdrawal allowing for global microglial (GLOBAL) and white matter microglia (WM) repopulation. For GLOBAL repopulation: 2-month-old wild-type (WT) mice were treated with 600 ppm of PLX3397 for 7 days, achieving ~90–98% brain-wide microglial depletion, with remaining microglia visibility dispersed throughout the brain parenchyma, and then placed on control diet for 7 days (7d recovery) allowing for microglial repopulation. At 7 day recovery, repopulating microglia reconstitute the brain from areas in which previously remaining microglia were deposited. For WM repopulation: 2-month-old WT mice were treated with 600 ppm of PLX3397 for 14 days, achieving 99.98% brain-wide microglial depletion, and then placed on control diet for 7 days allowing for microglial repopulation. At 7 day recovery, repopulating myeloid cells reconstitute the brain in specific neuroanatomical niches (e.g. ventricle, subventricular zone, white matter tracts, caudoputamen). (C–D) Representative immunofluorescence whole brain images of myeloid cells (IBA1, green) at each time point of treatment and recovery during GLOBAL (C) and WM (D) repopulation, with white dots superimposed over microglia. Due to the differential kinetics of these two forms of repopulation, repopulation (i.e. recovery) was evaluated at different timepoints, including initial stages with few cells, mid-repopulation, and full brain reconstitution. For GLOBAL repopulation: 2-month-old WT mice treated with control, 7 days of PLX3397 (7d PLX3397), 7 days of PLX3397 followed by 1 day on control diet (1d Recovery), 7 day of PLX3397 followed by 2 days on control diet (2d Recovery), 7 days of PLX3397 followed by 3 days on control diet (3d Recovery), and 7 days of PLX3397 followed by 7 days on control diet (7d Recovery). For WM repopulation: 2-month-old WT mice treated with control, 14 days of PLX3397 (14d PLX3397), 14 days of PLX3397 followed by 3 days on control diet (3d Recovery), 14 days of PLX3397 followed by 7 days on control diet (7d Recovery), 14 days of PLX3397 followed by 14 days on control diet (14d Recovery), and 14 days of PLX3397 followed by 28 days on control diet (28d Recovery). (C1–C4, D1–D4) Inserts of higher resolution confocal images of IBA1+ cells during repopulation. White dotted lines and yellow arrows highlight ‘wave’ edge and direction. (E–G) Quantification of IBA1+ cells per field of view (FOV) at each time point in cortical and white matter regions, respectively during GLOBAL (E) and WM (F–G) repopulation. (H) Pharmacokinetics analysis of PLX3397 levels in plasma and brain of mice treated with 7 day and 14 day PLX3397 (600 ppm). (I) Representative 63x immunofluorescence images of myeloid cells (IBA1, white) display morphological alterations. (J–L) Quantification of IBA1+ cell morphology: cell body area in the white matter tract (J), average process/filament length (K), and process complexity/branching (L) in the piriform cortex. Level 1–3+ indicates level of branching from the cell body. Data are represented as mean ± SEM (n=3–4). *p < 0.05, ** p < 0.01, *** p < 0.001; significance symbols represent comparisons between groups: (E) control *, 0d #, 1d ⋄, 2d Δ, 3d Φ; (F–G) control *, 0d #, 3d ⋄, 7d Δ. CC, corpus callosum; CTX, cortex; HC, hippocampus; LV, lateral ventricle.

