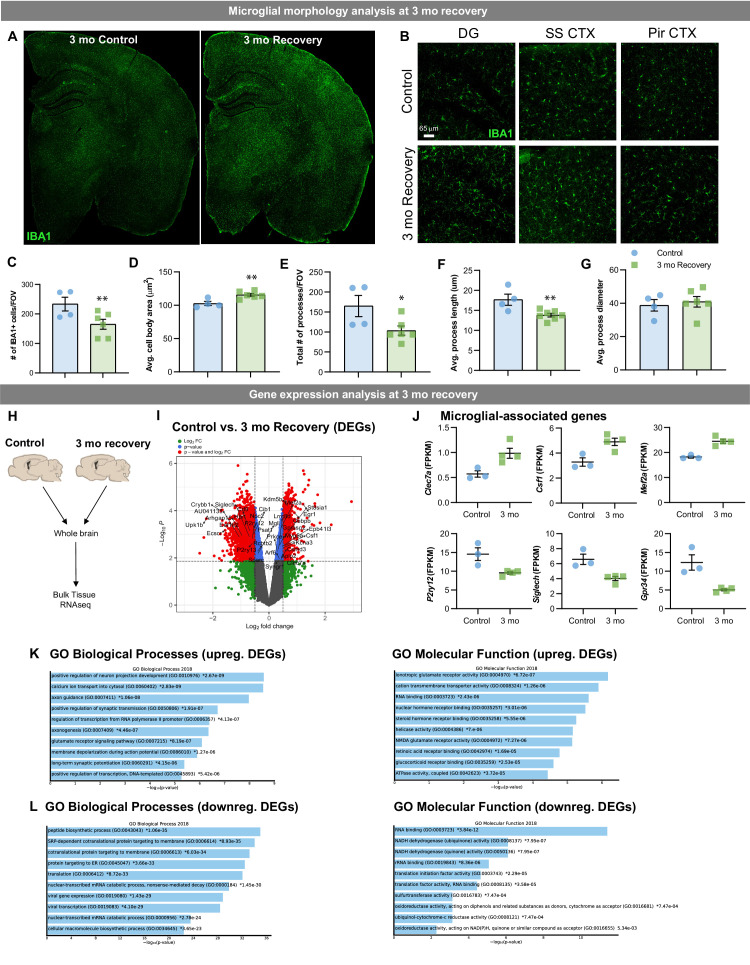
Figure 10. Lasting phenotypic and transcriptional profiles of WM repopulating cells after 3 month recovery.
Two-month-old WT mice treated with vehicle or PLX3397 (600 ppm in chow) for 14 days. Chow was then withdrawn, and animals were allowed to recover on control diet for three months, assessing the long-term effects of filling the brain with WM repopulated myeloid cells. (A-B) Representative whole brain slice and 20x immunofluorescence confocal images of IBA1+ cells in control and 3-month recovery mice. (C-G) Quantification of IBA1+ cells and morphology: IBA1+ cells per field of view (C), cell body area (D), total number of IBA1+ processes (E), average process/filament length (F), and average process/filament diameter (G). (H-L) Transcriptional analysis of 3-month recovery WM repopulation brain tissue. (A) Bulk tissue RNA-seq analysis was performed on whole brain hemispheres from control and 3-month recovery brains. (I) Volcano plot displaying the fold change of DEGs (log2 scale) and their significance (y axis, -log10 scale) between control vs. 3 month recovery. (J) Quantification of relative expression (FPKM, fragments per kilobase of transcript per million) for microglial-associated genes in control and 3 month recovery brain tissue. (K-L) Gene ontology analysis of upregulated (K) and downregulated (L) DEGs between control and 3 month recovery mice. Data are represented as mean ± SEM (n=3-4). * p < 0.05, ** p < 0.01. DG, dentate gyrus; SS CTX, somatosensory cortex; Pir CTX, piriform cortex.

