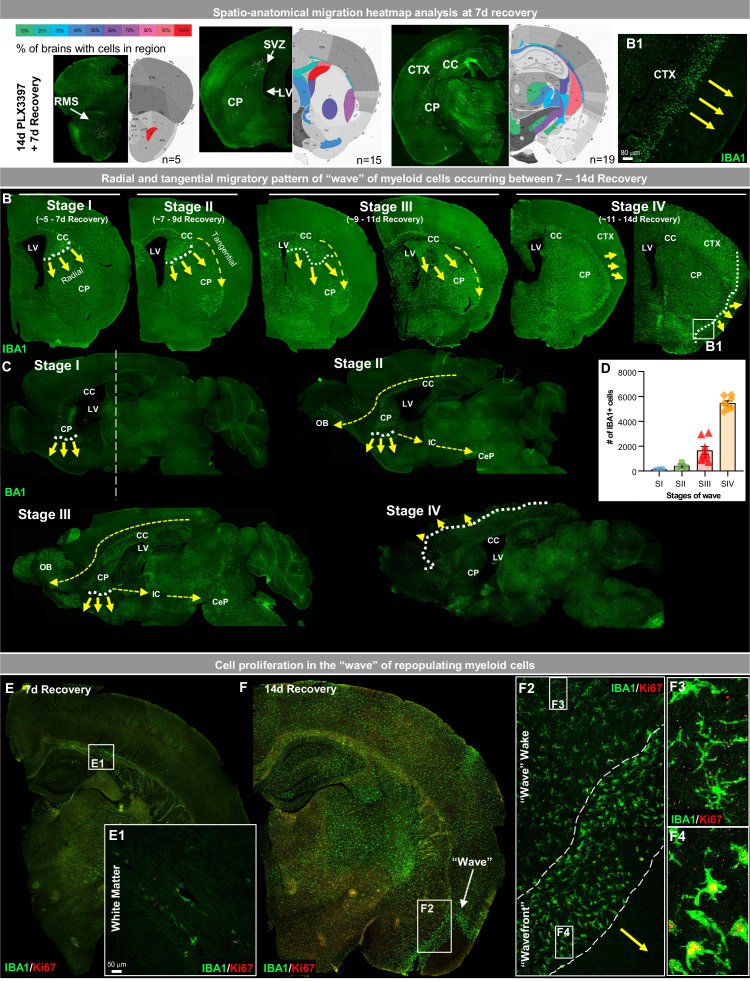
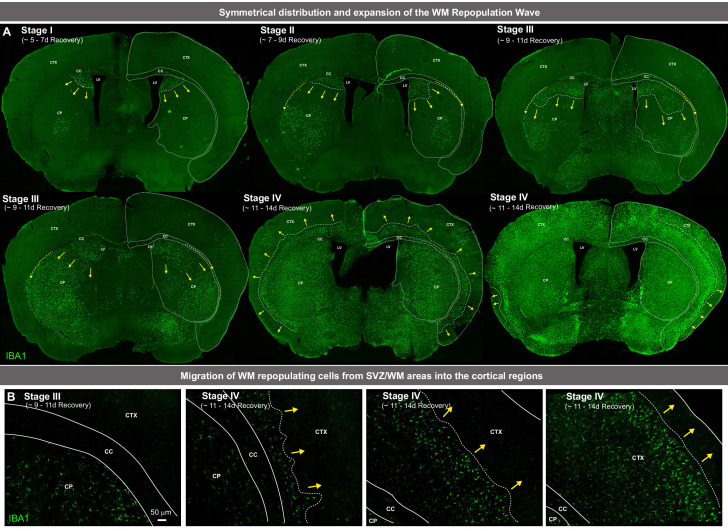
Figure 2. White matter microglia (WM) repopulation elicits a dynamic wave of repopulating proliferative myeloid cells.
(A) Spatial heat map of WM repopulation at 7 day recovery in three brain positions (Bregma 2.58 mm, 1.10 mm, −2.06 mm) depicting % of brains with cells present in specific brain regions (n=5–19). (B–C) Immunofluorescence whole brain coronal (B) and sagittal (C) section images of IBA1+ cells (green) show a sequential time course of the ‘wave’ (see higher resolution image of wavefront in B1 insert) of myeloid cells filling the brain between 7 and 14 day recovery during WM repopulation. White dotted lines and yellow arrows indicate the edge and direction of the ‘wave’, highlighting the radial migratory patterns of WM repopulating cells. Yellow dashed arrows indicate the direction of the tangential migratory pattern of WM repopulating cells, mostly utilizing WM tracts. The straight white dashed line in C shows the Bregma position at which coronal sections were taken for B. (E–F) Representative immunofluorescence whole brain images of myeloid cells (IBA1, green) and proliferating cells (Ki67, red) at 7 (A) and 14 (B) day recovery. Insets show higher resolution of IBA1 and Ki67 colocalization in initially repopulating cells (A1) and in cells outside and inside the wavefront (B2-4). Data are represented as mean ± SEM (n=3–8).


