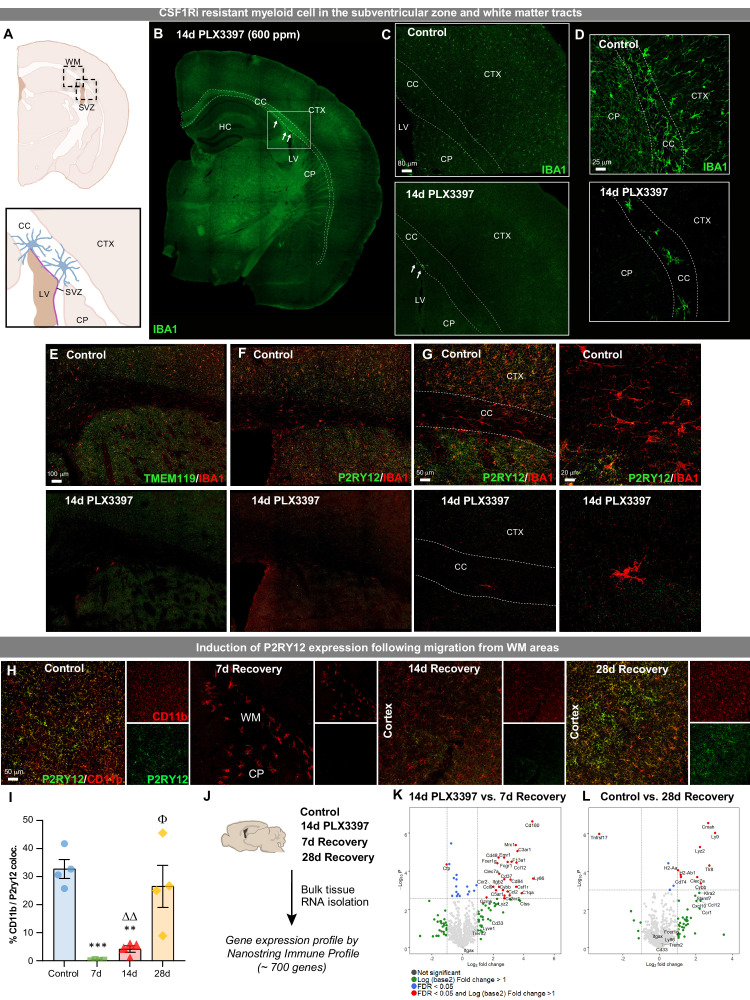
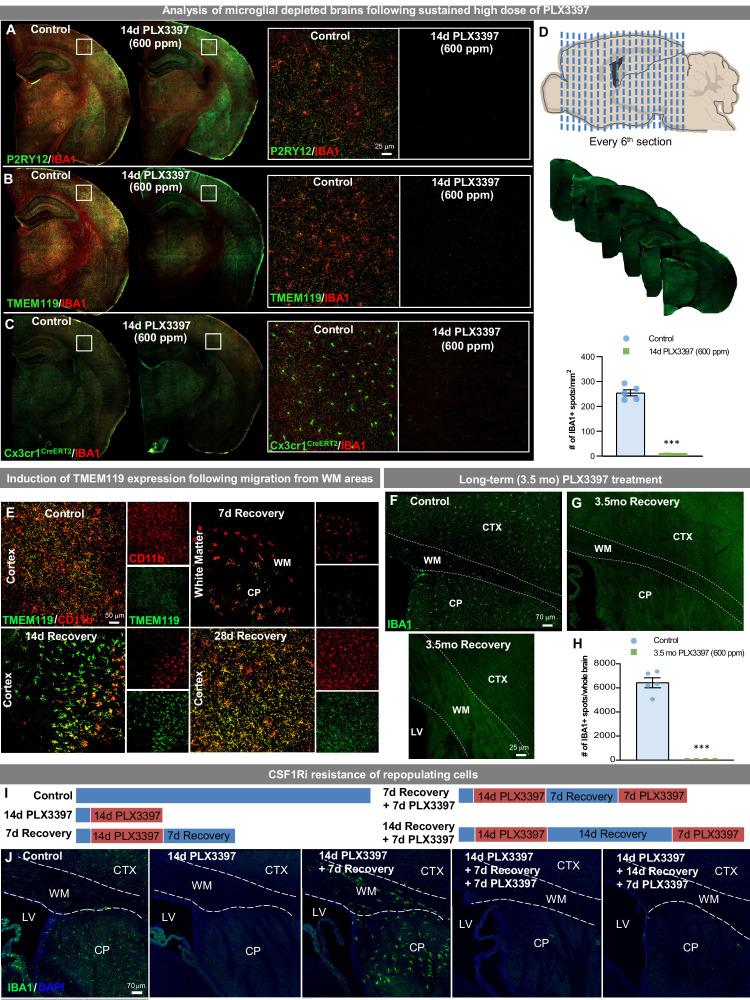
Figure 3. Extensive CSF1R inhibition unveils the presence of CSF1Ri-resistant myeloid cells in the subventricular zone and white matter tracts.
Two-month-old WT mice treated with vehicle or PLX3397 (600 ppm in chow) for 14 days to evaluate extent of microglial depletion. (A) Brain section schematic of SVZ and WM areas where CSF1Ri-resistant myeloid cells are present following 14 day PLX3397 (600ppm in chow) treatment. (B) Representative whole brain slice image of CSF1Ri-resistant IBA1+ cells (white arrows) near the SVZ/WM areas (white box) surrounding the lateral ventricle. (C–D) Representative tile scan (C) and high-resolution confocal (D) images of control and 14 day PLX3397 mice showing the deposition of surviving SVZ/WM IBA1+ (green) cells in WM areas (white dotted lines). (E–G) Representative tile scan (E–F) and confocal immunofluorescence image of IBA1+ cells co-stained with microglial-specific markers TMEM119 (E) and P2RY12 (F–G) in control and 14 day PLX3397 mice, showing that CSF1Ri-resistant cells are TMEM119- and P2RY12-. Higher resolution images illustrate atypical morphological profile of CSF1Ri-resistant cells. (H) Representative 20x images of myeloid cells (Cd11b, red) and P2RY12 (green). (I) Quantification of % colocalization of CD11b+ and P2RY12+ cells as seen in (H). (J) Control, 14 day PLX3397, 7 day recovery, and 28 day recovery mouse hemispheres were collected and analyzed for bulk-tissue gene expression changes using Nanostring Immune Profile. (K–L) Volcano plots displaying the fold change of genes (log2 scale) and their significance (y axis, -log10 scale) between 14 day PLX3397 depleted vs. 7 day recovery mice (K) and control vs 28 day recovery (L). Data are represented as mean ± SEM (n=3–5). *p < 0.05, ** p < 0.01, *** p < 0.001; significance symbols represent comparisons between groups: control *, 0d #, 3d ⋄, 7d Δ, 14d Φ. CC, corpus callosum; CP, caudoputamen; CTX, cortex; HC, hippocampus; LV, lateral ventricle; SVZ, subventricular zone; WM, white matter.


