. 2021 Aug 23;10:e66738. doi: 10.7554/eLife.66738

Figure 7. WM repopulating cells do not derive from the periphery.

(A) Representative immunofluorescence 10x (A) and 63x (B) images of IBA1+ cell deposition within the choroid plexus (labeled with Collagen IV) in control, 14 day PLX3397, 7 day recovery, and 28 day recovery mice. (B) Quantification of IBA1+ cell deposition in the choroid plexus and parenchymal space. (C, D) Sustained microglial depletion and WM repopulation in Cx3cr1GFP/GFP/Ccr2RFP/RFP (i.e., Cx3cr1 and Ccr2 KO). Representative immunofluorescence images (C) and quantification of the number (D) of CX3CR1-GFP+ (green) and CCR2-RFP+ (red) cells in control, 14 day PLX3397, and 7 day recovery mice (n=3–5). (E) Experimental paradigm: Schematic depicting generation of BM GFP+ chimeras, achieved by head-shielded (HS) irradiation and transplantation of donor GFP+ BM cells. After 3 months, mice were treated for 14 days with PLX3397 and then allowed to recover for 7 or 14 days on control diet. (F) FACS gating strategy to determine % chimerism in BM GFP+ chimeras achieved by head-shielded irradiation. (G–J) Representative whole brain images of GFP+ (green) and IBA1+ (red) cell deposition in HS irradiated control (G), 14 day PLX3397 (H), and mice following 7 (I) and 14 day recovery (J). (J1) Higher resolution images of repopulating cell wavefront seen in HS chimeras during WM repopulation. (K) Quantification of number of GFP+ and IBA1+ cells treated HS irradiated mice. % above bar graph indicates %GFP+IBA1+/IBA1+ cells. Data are represented as mean ± SEM (n=3–7). *p < 0.05, ** p < 0.01, *** p < 0.001. CTX, cortex; CP, caudate putamen; LV, lateral ventricle; ChP, choroid plexus; WM, white matter.

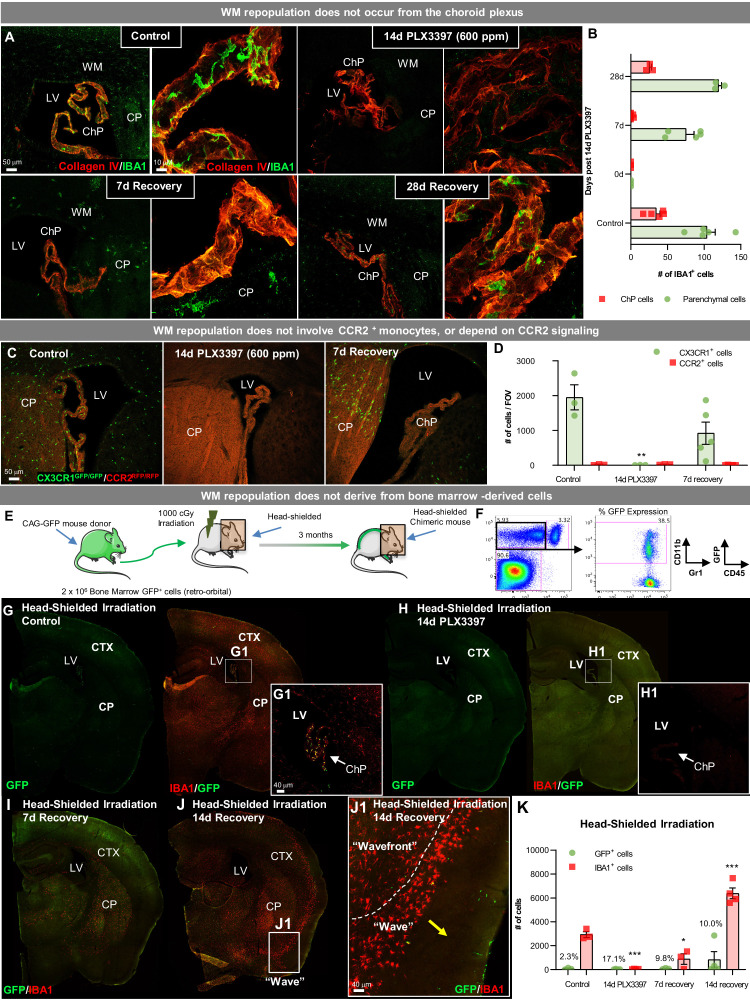
Figure 7—source data 1. WM repopulating cells do not derive from the periphery.

Figure 7.

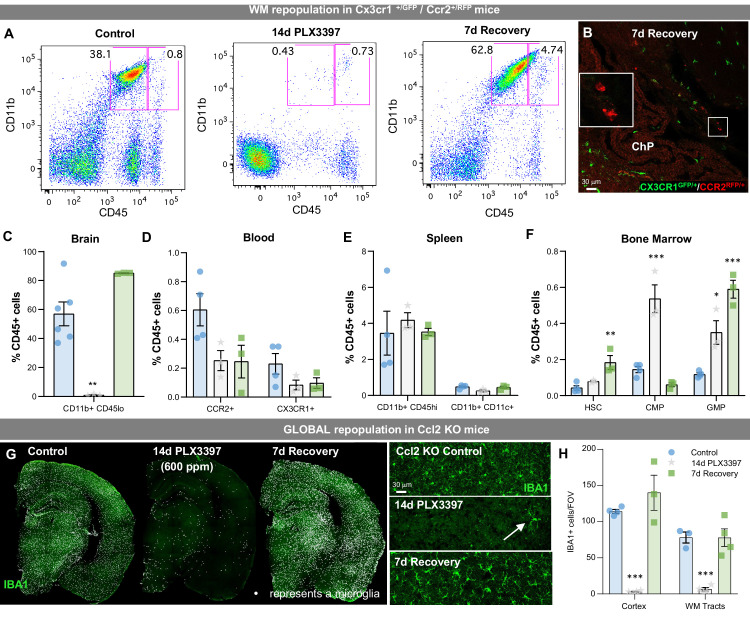
Figure 7—figure supplement 1. Evaluation of peripheral cell dynamics and CCL2 signaling in WM repopulation.

Figure 7—figure supplement 1.

(A–F) Sustained microglial depletion and WM repopulation in Cx3cr1GFP/+CCR2RFP/+mice. (A) Flow cytometry gating strategy for identifying microglial (CD11b+CD45lo) cells in the brain. (B) Representative immunofluorescence image of CX3CR1+ (green) and CCR2+ (red) cells in 7 day recovery mice. WM repopulation is apparent and no CCR2+ cells are present in the brain parenchyma. CCR2+ cells are only found in the choroid plexus (see insert), indicating that repopulating cells do not derive from CCR2+ (a common marker for peripheral myeloid cells or monocytes) cells. (C–F) Quantification of the impact of treatment on microglia in the brain (C) and distinct myeloid or myeloid precursor cell subsets in the blood (D), spleen (E), and bone marrow (F). (G–H) Ccl2 KO mice were treated with PLX3397 for 14 days (600 ppm in chow), the drug was withdrawn, and then mice were provided with 7 days to recover, allowing for repopulation. (G) Representative whole brain images of IBA1+ (green) cells in these animals, showing incomplete microglial depletion leads to GLOBAL repopulation. Inserts show higher resolution images of IBA1+ (green) cells. (H) Quantification of the average number of IBA1+ cells per FOV in the cortex and white matter tract of control, 14 day PLX3397 (600 pm), and 7 day recovery mice. Data are represented as mean ± SEM (n=3–4). *p < 0.05, **p < 0.01, ***p < 0.001. ChP, choroid plexus; HSC, hematopoietic stem cell; CMP, common myeloid progenitor; GMP, granulocyte-macrophage progenitor.