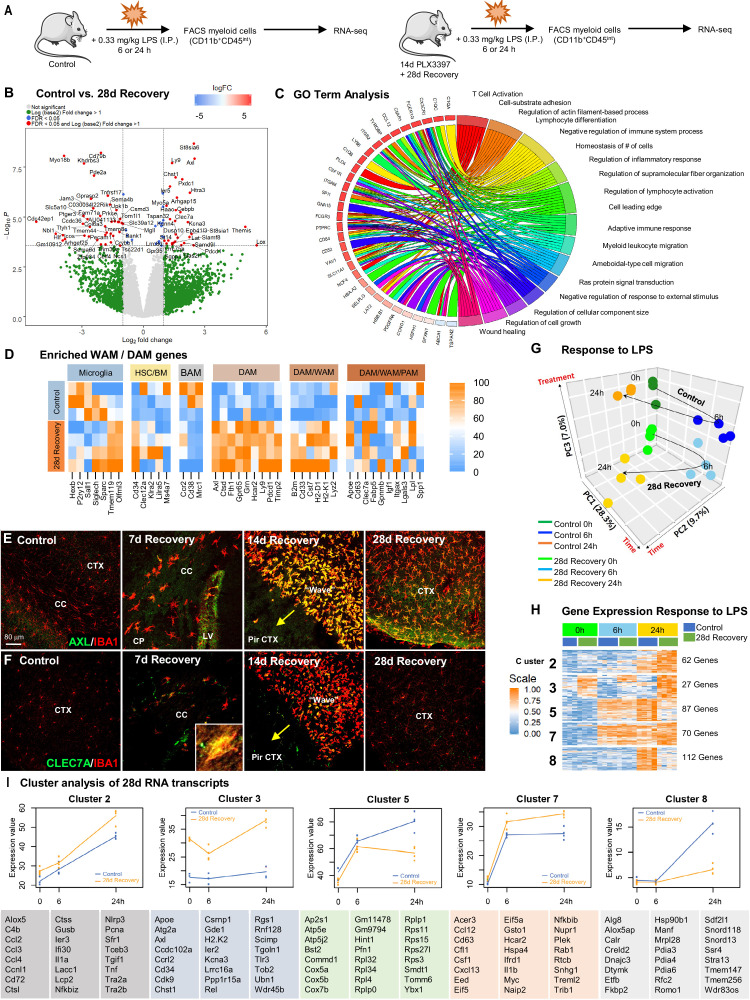
Figure 8. Repopulating myeloid cells are transcriptionally distinct and mount a differential response to inflammatory stimulus compared to homeostatic microglia.
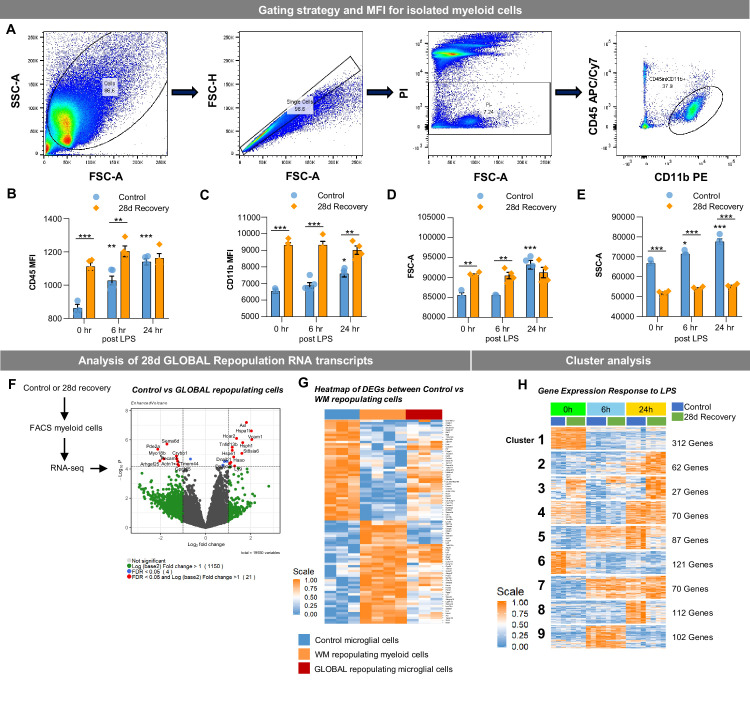
(A) Two-month-old WT control or 28 day recovery mice were given intraperitoneal injections of either PBS or LPS (0.33 mg/kg) and then collected at 6 or 24 hr post injection. Controls, which were mice that did not receive LPS, are referred to as 0 hr post LPS. Myeloid cells were extracted from whole brain hemispheres, isolated using FACS gating for CD11b+CD45int and processed for RNA-seq. (B) Volcano plots displaying the fold change of genes (log2 scale) and their significance (y axis, -log10 scale) between control vs. 28 day recovery mice. (C) Gene ontology chord plot of DEGs between control and 28 day recovery myeloid cells. (D) Heatmap showing expression of genes enriched in DAM, HSC/BM-derived cells, canonical microglia, BAM, PAM, and WAM signatures in control and 28 day repopulating myeloid cells. (E–F) Representative immunofluorescence 20x images of IBA1+ (red) and AXL+ (green, I) or CLEC7A+ (green, J) cells shown in areas with high repopulating cell deposition in control, 7, 14, and 28 day recovery mice. (G) Principal component analysis plot of extracted control and 28 day recovery cells, across time (0 hr, 6 hr, 24 hr) and treatment (+/- LPS), depicting the separation of groups into six clusters. (H) Heatmap of selected time-series cluster analysis of control and 28 day recovery cells. Provided number indicates number of genes per cluster. (I) Time-series cluster analysis of control vs. 28 day recovery myeloid cell response (during WM repopulation) to LPS challenge following 14 day PLX3397 (600 ppm in chow; from H). Clusters showing distinct responses to LPS between control and 28 day WM repopulated cells, across time, were plotted as eigengene values, along with the top represented genes within each cluster. Data are represented as mean ± SEM (n=3–5). *p < 0.05, ** p < 0.01, *** p < 0.001. CP, caudoputamen; CC, corpus callosum; CTX, cortex; LV, lateral ventricle; PirCTX, piriform cortex. Gene expression data can be explored at http://rnaseq.mind.uci.edu/green/alt_repop_lps/gene_search.php.


