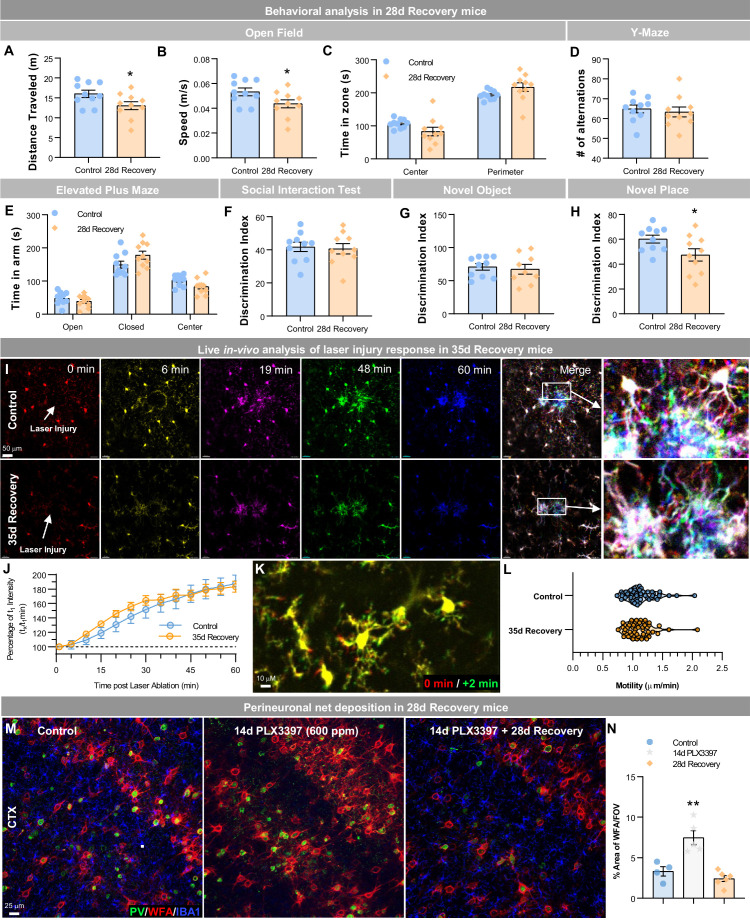
Figure 9. Repopulating myeloid cells elicit few functional differences in behavior, injury, and neuronal-associated structures.
(A–H) Two-month-old WT mice treated with vehicle or PLX3397 (600 ppm in chow) for 14 days, followed by 28 days of recovery, filling the brain with WM repopulated myeloid cells. Mice underwent behavioral assessment by Open Field, Y-Maze, and Elevated Plus Maze, Social Interaction Test, and Novel Object/Place recognition. In Open Field, distance traveled (A) and average speed (B) were reduced in 28 day recovery groups, but time spent in each zone (C) was unchanged. No changes in performance were seen in the Y-maze, as measured by the number of alternations (D). No changes in anxiety behaviors were seen in the elevated plus maze, as measured by time spent in the open or closed arms (E). No changes in social preference were seen in the social interaction test (F). No changes in novel object recognition memory were seen (G), but 28 day recovery mice had a significant impairment in novel place recognition memory (H). Data are represented as mean ± SEM (n=10). *p < 0.05. (I–L) Two-month-old Cx3cr1-GFP+ mice treated with vehicle or PLX3397 (600 ppm in chow) for 14 days, followed by 35 days of recovery, filling the brain with WM repopulated myeloid cells. (I) Analysis of motility and focal laser response in WM repopulating myeloid cells. Representative images of Cx3cr1-GFP+ myeloid cell response to laser ablation, over time, obtained via two-photon imaging in control and 35 day recovery mice. (J) Quantification of the average normalized GFP+ intensity measured within a 50 µm radius of the site of damage over time. (K) Representative image of Cx3cr1-GFP+ myeloid cell at process motility from 0 min (red) to 2 min (green) time-period. (L) Quantification of process motility (i.e. extension of process µm per min) measuring the difference in visibly moving processes over 2 min in control and 28 day recovery myeloid cells. Data are represented as mean ± SEM (n=4). (M–N) Two-month-old WT mice treated with vehicle or PLX3397 (600 ppm in chow) for 14 days, followed by 28 days of recovery, filling the brain with WM repopulated myeloid cells. (M) Representative immunofluorescence 20x images of Parvalbumin+ (PV, green), WFA (a marker for perineuronal nets, red), and IBA1+ (blue) cells shown in the cortex of control, 14 day PLX3397, and 28 day recovery mice. (N) Quantification of % area of WFA per field of view (FOV) in the cortex. Data are represented as mean ± SEM (n=4–6). ** p < 0.01.


