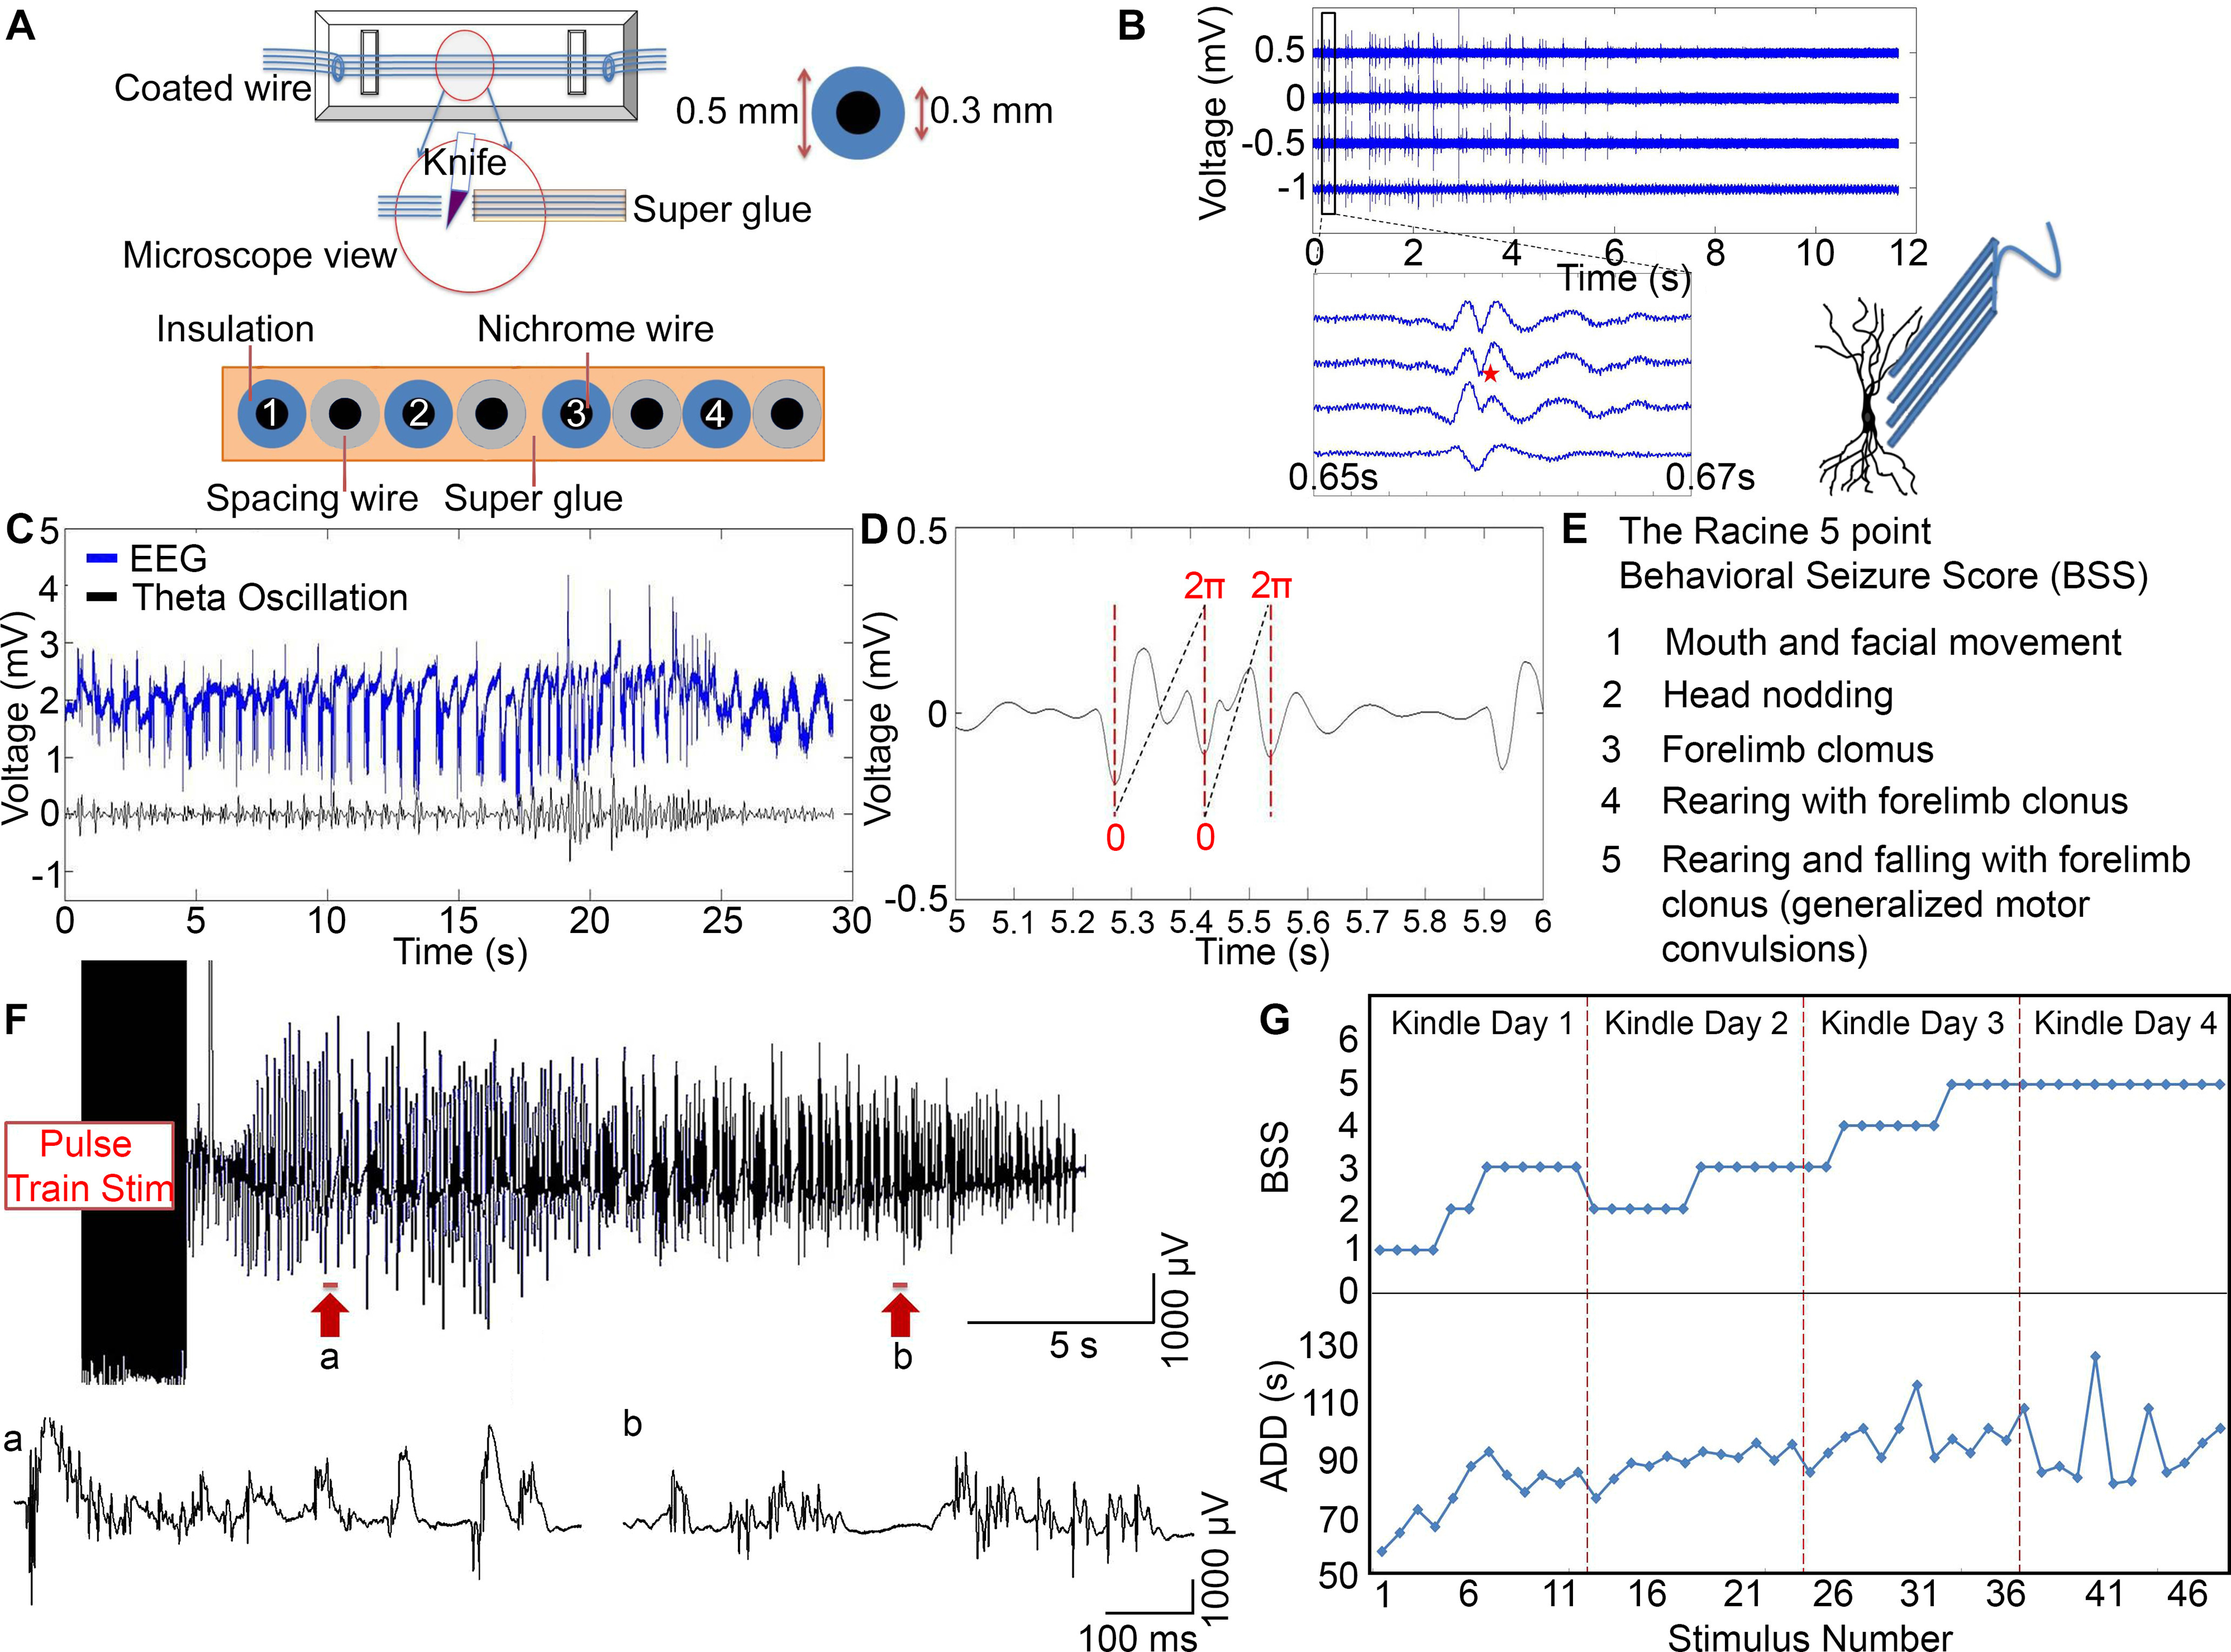
Figure 1.

Kindling progression in awake rats. A, Schematic of the microelectrode construction and dimensions of the outer and inner diameters of the wire. The tips were cut transversely with a sharp knife and examined under a microscope to make sure no Superglue was attached on the cross section surface. Each of the 4 microelectrodes was separated by an additional 50 µm spacing wire. B, The waveform of a spike varied as a function of distance from the cell body. Schematic figure represents microelectrode array placement along the somatodendritic axis. Four channels of bandpass-filtered data (300-4000 Hz): An electrically evoked seizure was immediately recorded after 10 s of stimulation. Enlarged view, Waveform of a single spike (red star). C, Top, EEG signal. Bottom, Theta oscillation. D, The waveform is the theta oscillation. Red dotted lines indicate the negative peaks of the theta oscillation. The theta cycle is defined as the time between two negative peaks. Each time point is assigned with a theta phase value from 0 to 2 via linear interpolation. E, The Racine 5 point BSS. F, Top, A representative example of an electrically evoked seizure that was recorded in an awake rat immediately after 10 s of stimulation. The EEG was filtered >1 Hz. Bottom, a, b, Expanded views of two segments of the EEG data, taken from the sections indicated by the arrows beneath the top trace. G, A representative example of BSS and ADD as they increased in severity during 4 d kindling for 1 animal.
