
Figure 2.
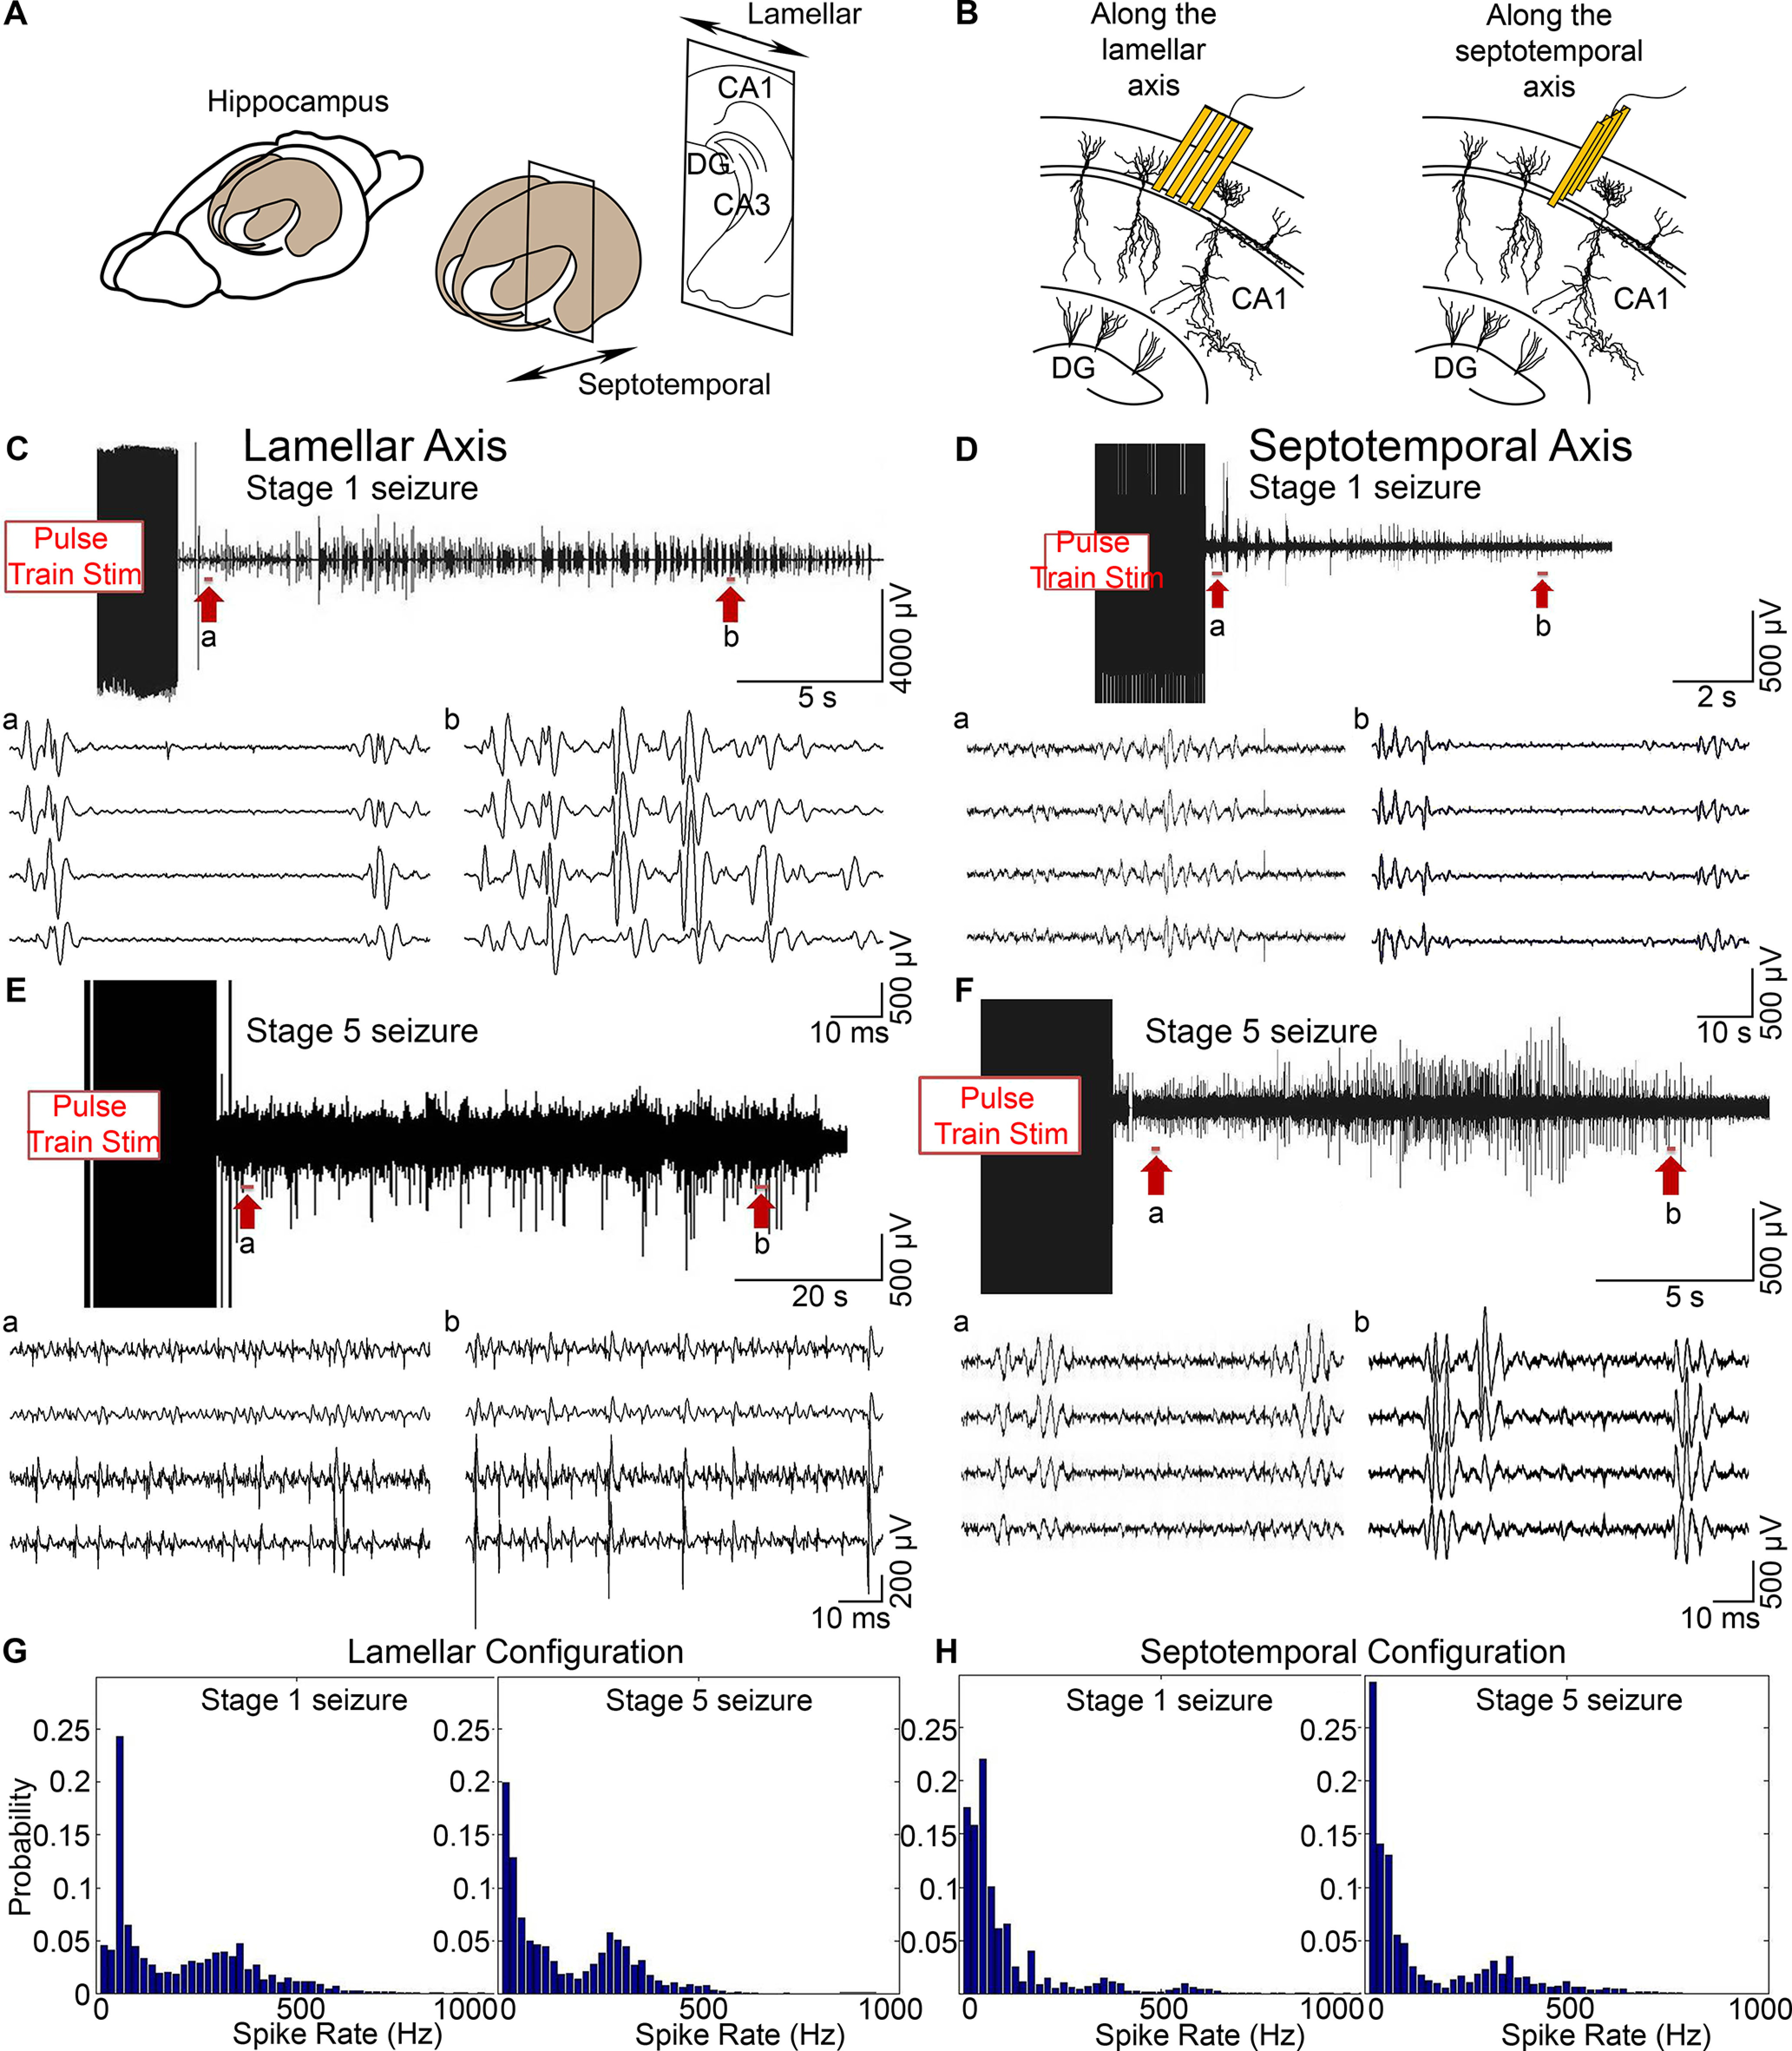
High-frequency firing and spike rate distributions along the lamellar and septotemporal axes. A, The rat hippocampus is indicated in both the lamellar and septotemporal directions. B, Schematic figures of the microelectrode array placement in the hippocampal CA1 cell layer. C, E, High-frequency firing along the lamellar axis. EEG was filtered between 300 and 4000 Hz to extract high-frequency firing data. High-frequency firing during a Stage 1 seizure (C) and a Stage 5 seizure (E). Top traces, One channel of the filtered seizure data. Bottom, a, b, Expanded views of the top traces indicated by the arrows. D, F, High-frequency firing along the septotemporal axis. High-frequency firing during a Stage 1 seizure (D) and a Stage 5 seizure (F). G, H, Spike rate distributions during kindling. Spike rates of Stage 1 and Stage 5 seizures in the lamellar configuration (G) and the septotemporal configuration (H).