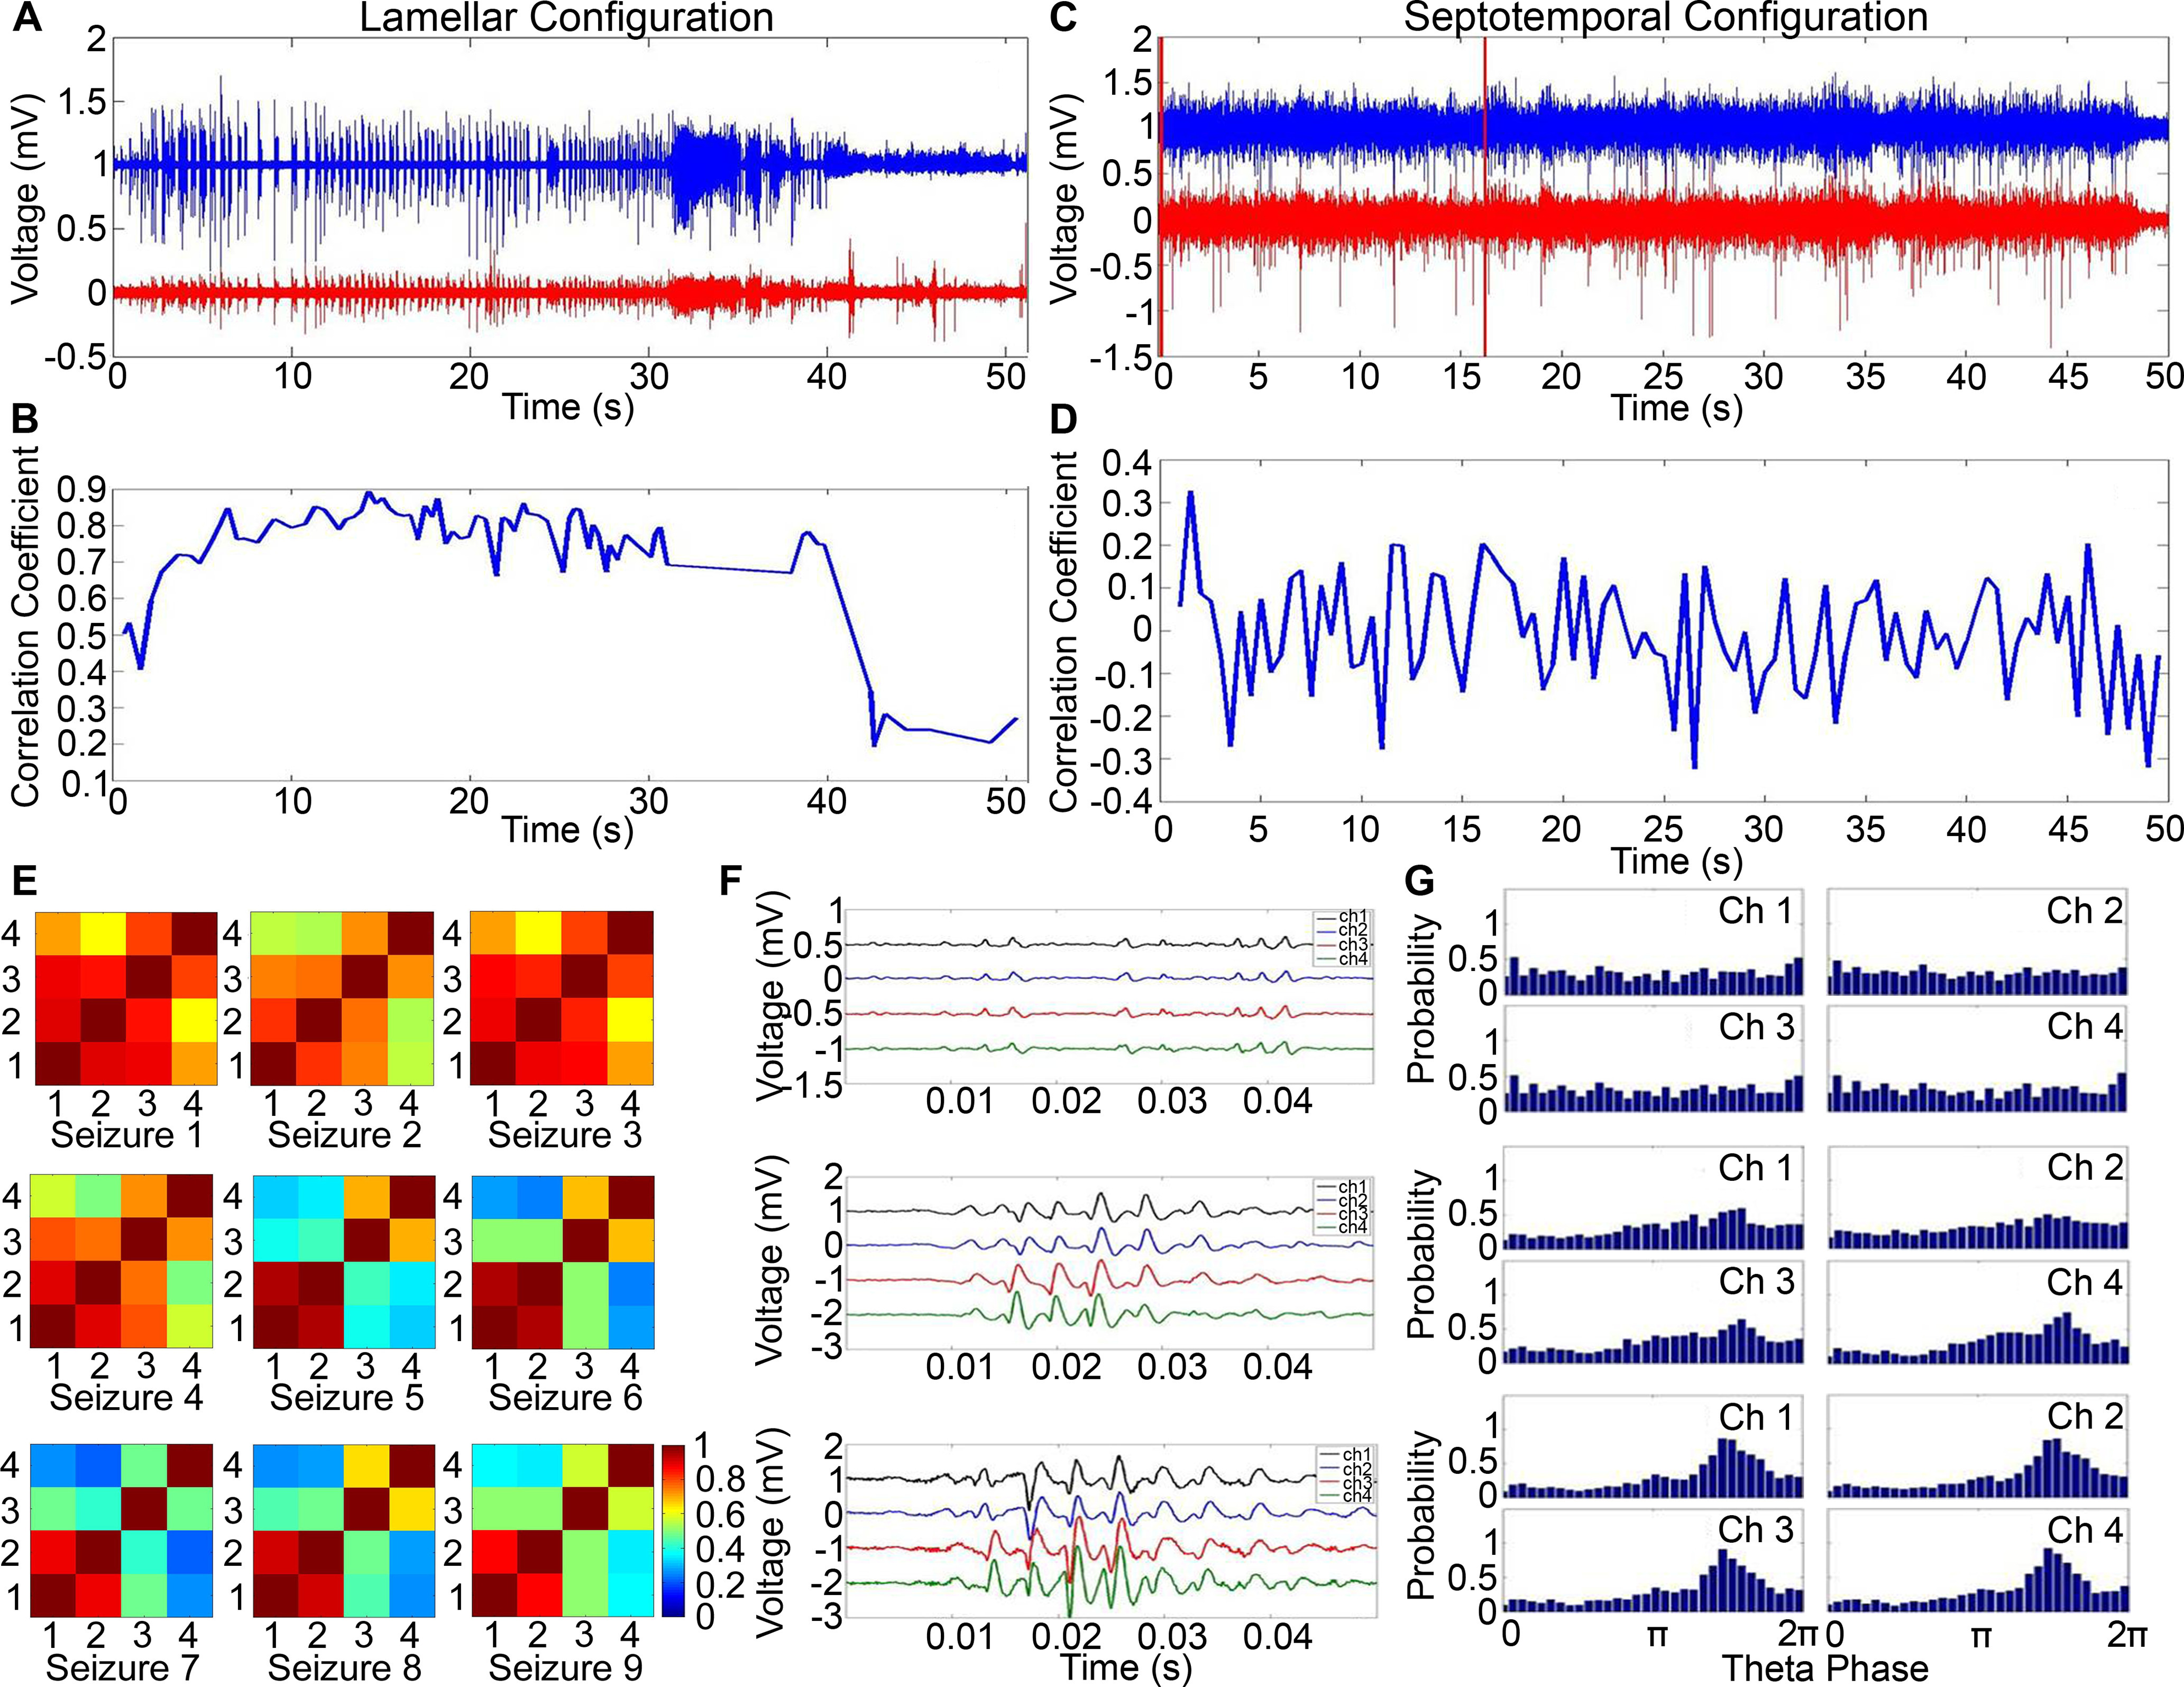
Figure 3.

A representative example of the correlation profile between two channels of the microelectrode array recording during seizures in awake rats. EEG data from two channels of the microelectrode array are plotted next to each other and the correlation coefficient against time in the lamellar configuration (A,B) and septotemporal configuration (C,D). E, The cross-correlation coeffcients across all pairwise combinations in awake rats in the lamellar direction. F, Discharge morphology as kindling progressed. G, Progression of theta oscillations with increasing number of stimulus.
