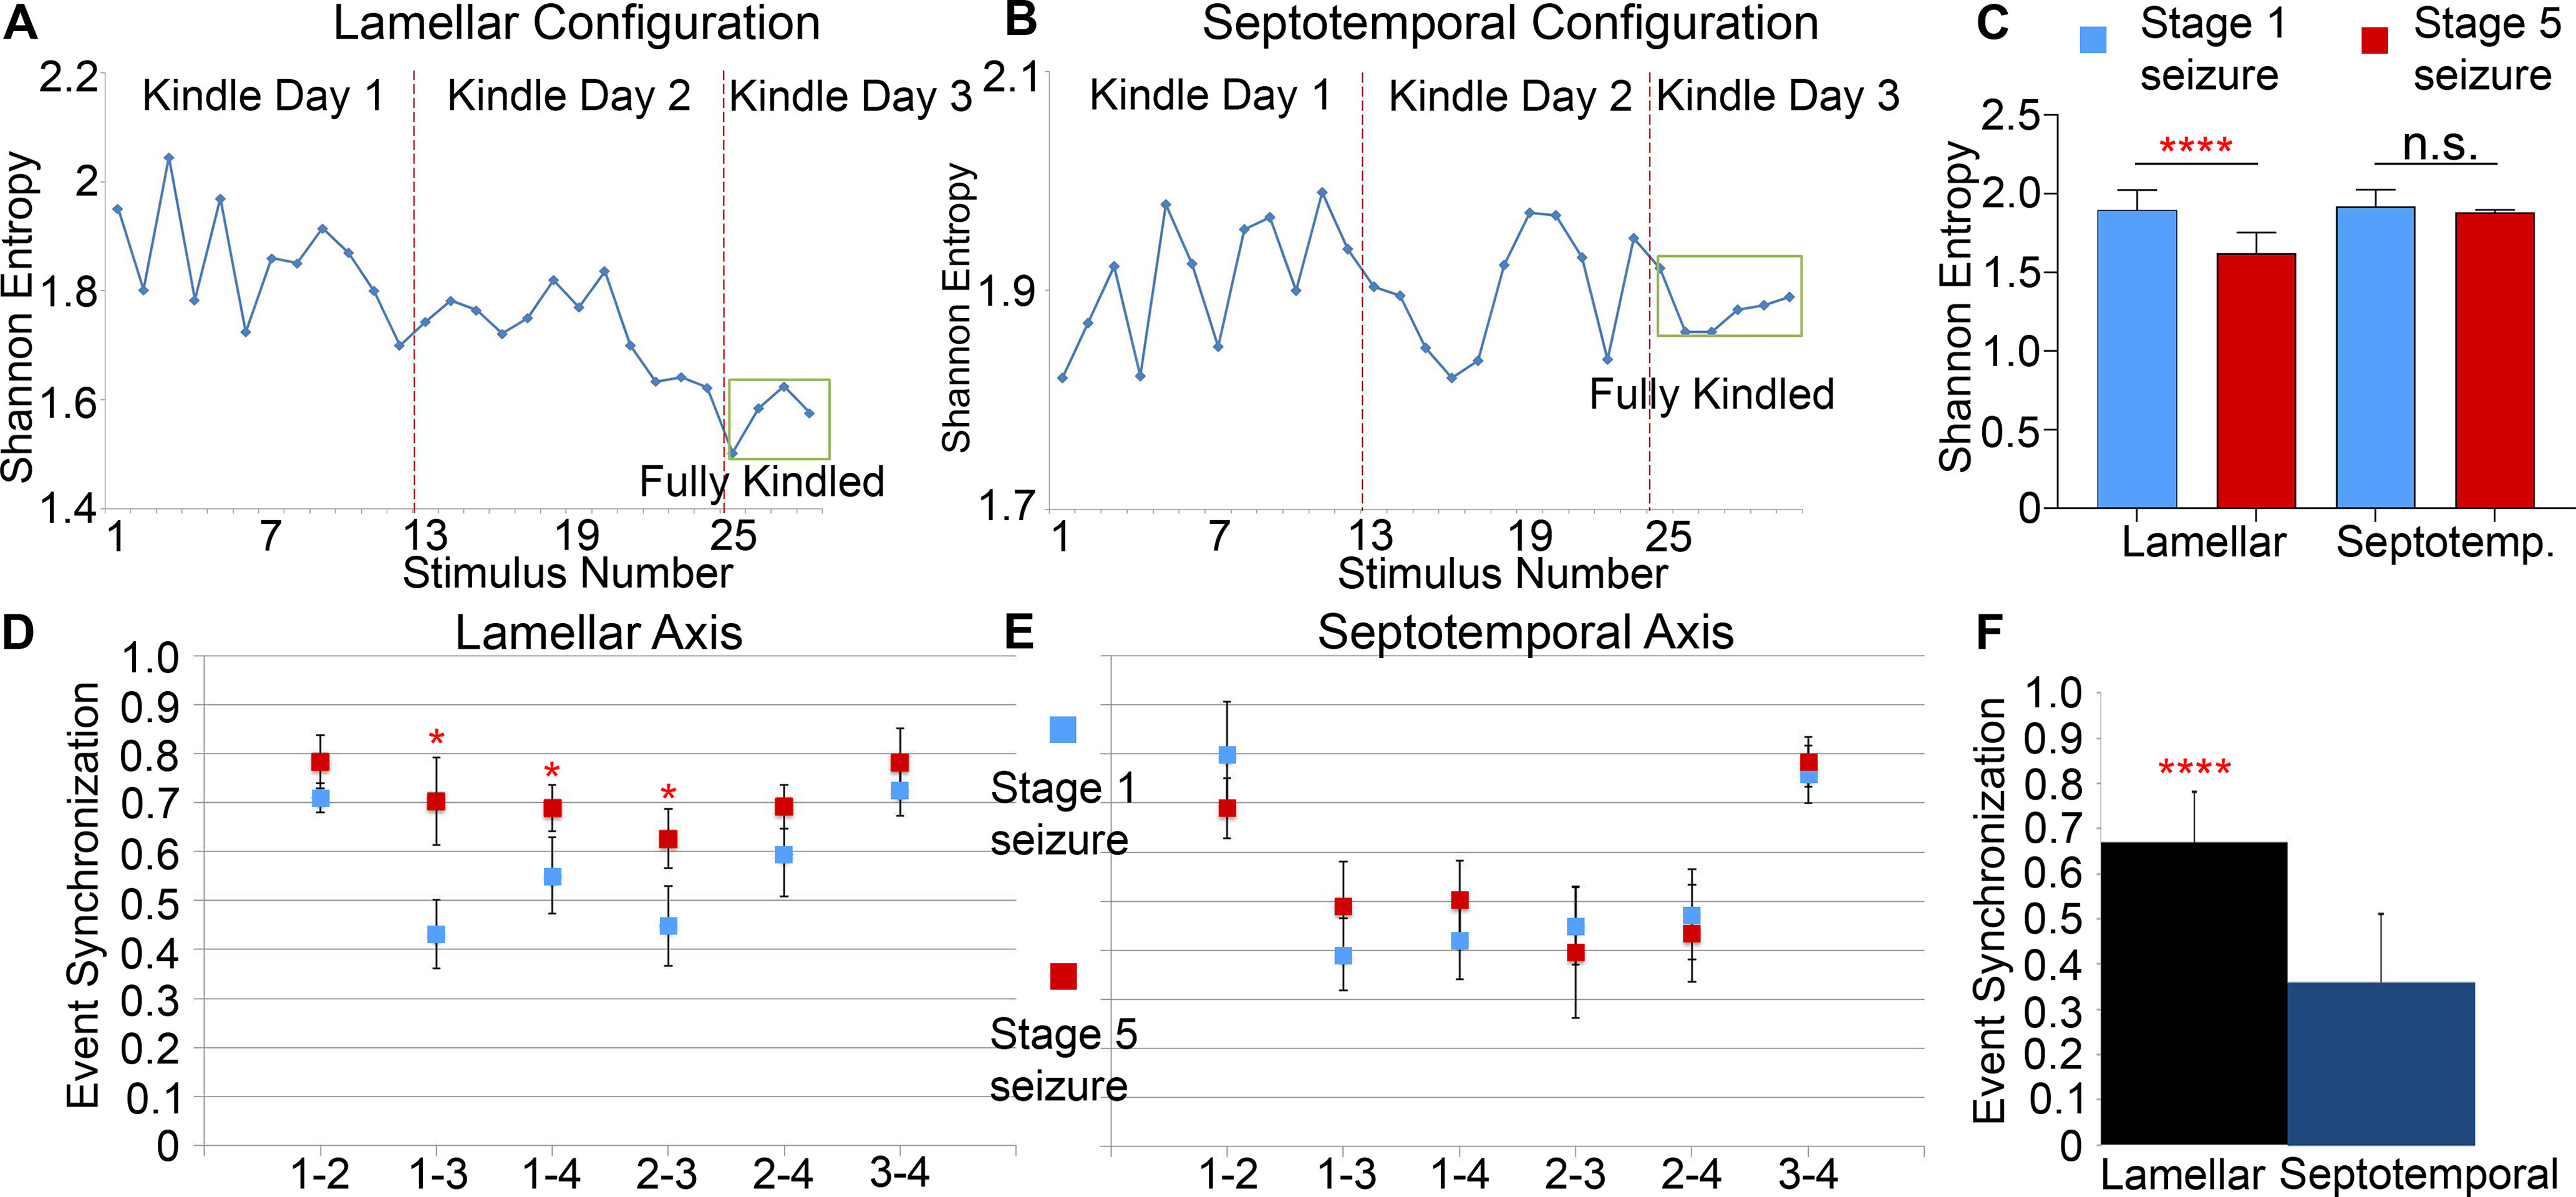
Figure 5.

Shannon entropy and ES along the lamellar and septotemporal axes. A, Shannon entropy attenuated as kindling progresses in the lamellar configuration. B, Shannon entropy fluctuated as kindling progressed along the septotemporal axis but showed no significant changes between stages. C, Grouped mean Shannon entropy between four channels for Stage 1 (blue) and Stage 5 (red) seizures in the lamellar and septotemporal configurations. As the BSS advanced from Stage 1 to Stage 5, the entropy level dropped for all four channels in the lamellar, but not septotemporal, configuration (paired t test). D, ES increased as kindling progressed along the lamellar axis. Blue squares represent Stage 1 seizures. Red squares represent Stage 5 seizures. E, ES showed no significant difference as kindling progressed along the septotemporal axis. F, ES was significantly higher in the lamellar direction than the septotemporal direction. ****p < 0.0001.
