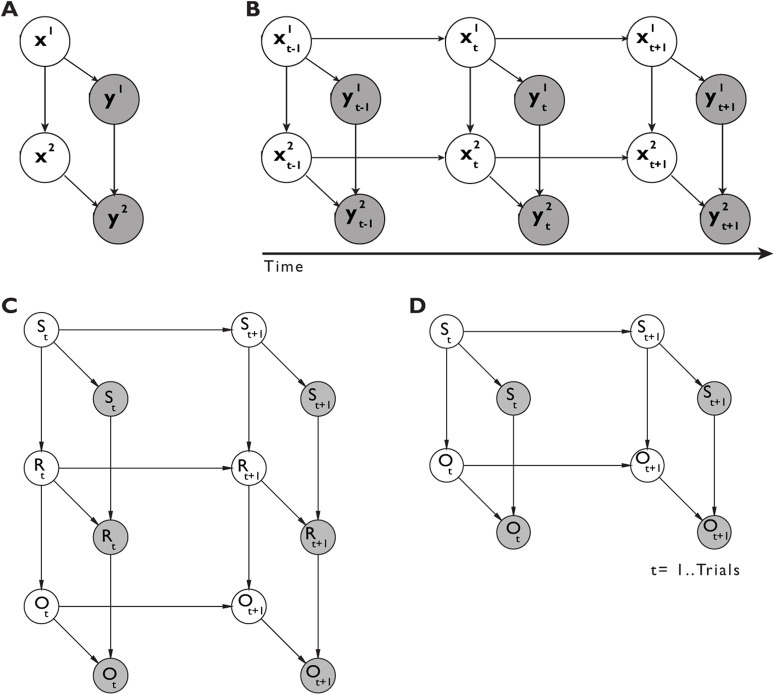
Figure 1.
DBN model. A, Bayesian network for one single trial with hierarchical rule representation. B, DBN extension of the single-trial model (A) unrolled for three time slices. C, Graph structure of control models DBNERO and DBNFRO. D, Graph structure of control models DBNFO and DBNCO. Empty nodes represent latent variables and shaded nodes observed variables. Links indicate statistical causal dependencies between variables, either across layers of the network or across time slices. The superscript index indicates the level of the hierarchical rule (e.g., x1 = level 1).

