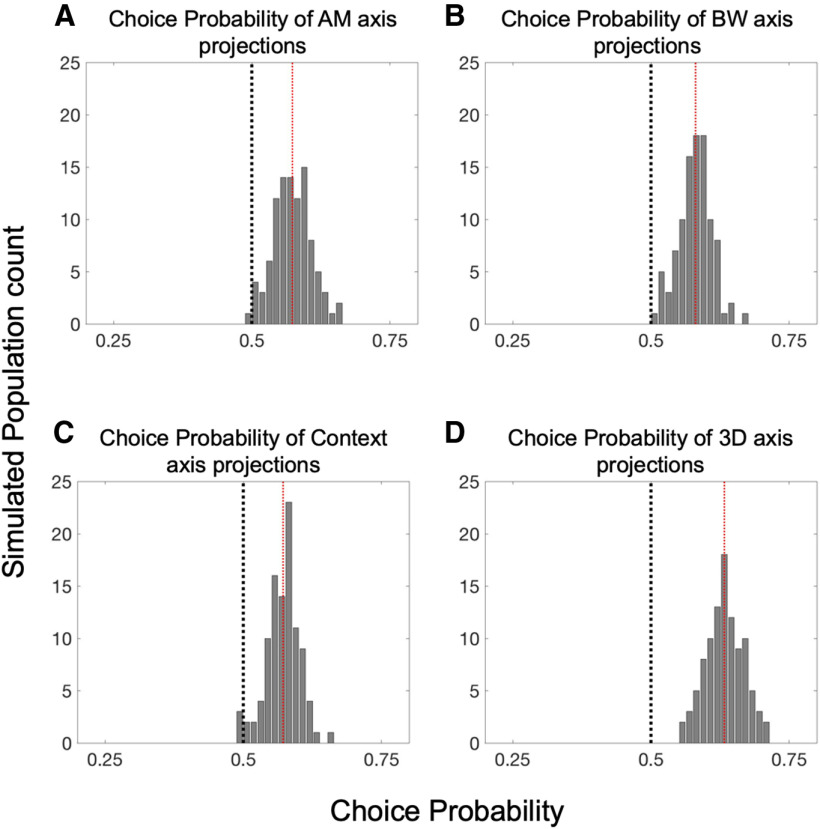
Figure 10.
Population subspace projections correlate with trial-by-trial performance. A, The distribution of CP values across 100 simulated populations reveals a significant relationship between AM-axis projections and task performance, as evidenced by a mean CP across simulations of 0.573 (p = 1.90e-39). Likewise, B, C reveal that projections along the BW and context axes also correlate with task performance, with mean CP values of 0.581 and 0.572, respectively (p = 4.82e-47 and 1.37e-42). D, Projections of population activity into the full three-dimensional task variable subspace (AM × BW × context) are very reliably performance related, as evidenced by the entire distribution of CP values across simulated populations lying above 0.5, with a mean of 0.633 (p = 1.12e-61). Each significance test was a Wilcoxon signed-rank test with a null hypothesis of CP = 0.5.

