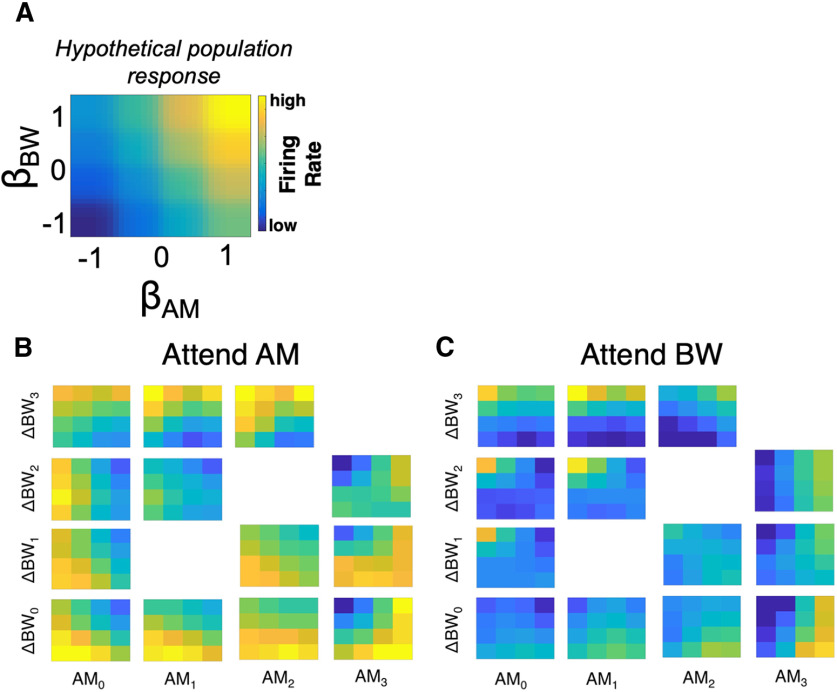
Figure 7.
A population-level analysis for feature encoding in A1. A, We provide a schematic illustration of our population-level analysis approach. The grid in A is a hypothetical population response pattern, with population FR organized by βAM and βBW. For this hypothetical response, the group of neurons with positive βAM and βBW exhibit high FRs. B, In our data, population response patterns differ across the stimulus set (population response grids arranged as the stimulus matrix in Fig. 1B), with clear differences in population responses related to increasing AM and BW levels. C, Moreover, comparing C to B reveals substantial differences in population responses related to attention.

