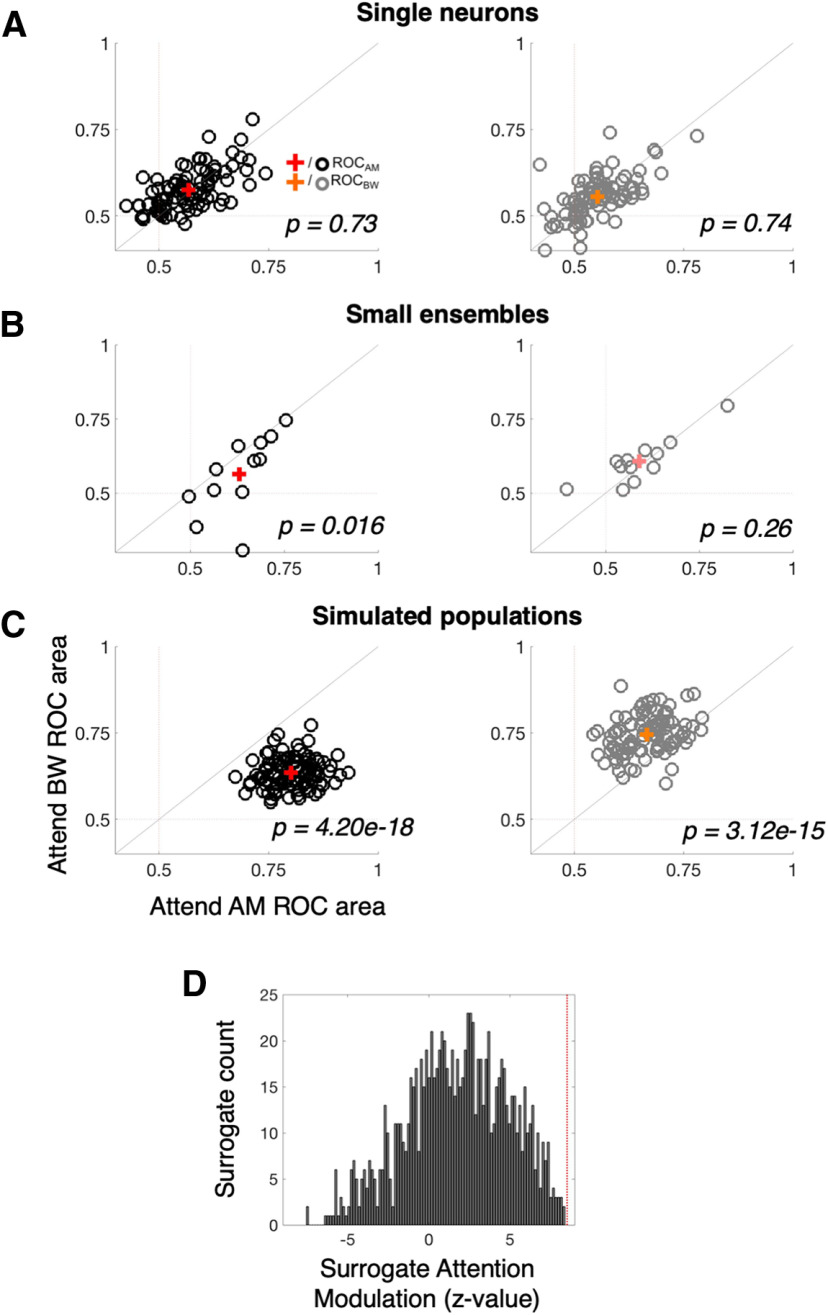
Figure 9.
Population, not single neuron, representations sharpen with attention. A, Single-neuron ROC areas (similar to Fig. 6F,G) are compared between the attend AM (x-axis) and attend BW (y-axis) conditions. Black (gray) “o” markers represent single neuron average AM (BW) ROC values, with the red (orange) “+” representing the mean AM (BW) ROC value across the population. AM ROC and BW ROC distributions each lie along the unity line, indicating no average effect of attention (p = 0.73 and 0.74, respectively). B, Small ensemble ROC areas (one black and one gray marker for each of the 12 ensembles) exhibit small effects of attention. AM ROC values are significantly greater during attend AM (0.63 vs 0.58, p = 0.016). BW ROC values are higher during attend BW but the difference is not statistically significant (0.61 vs 0.59, p = 0.26). C, Simulated population ROC areas (one black and one gray marker for each of the 100 simulated populations of size n = 92 neurons) differ significantly between attention conditions, such that the average AM ROC area is 0.159 higher during attend AM than attend BW (red +; p = 2.41e-30) and the average BW ROC areas is 0.108 higher during attend BW than attend AM (orange +; p = 3.08e-17). D, The distribution of attention modulation values (the z-scored increase in ROC area for each feature when it is attended vs ignored) for 1000 surrogate populations is compared against the observed attention modulation in the neural data (vertical red line). Although surrogate populations, on average, exhibit a positive attention modulation (as evidence by the peak of the distribution well above 0), the attention modulation observed in the neural data exceeds that of any given surrogate population. This indicates high confidence that the finding in B constitutes a synergistic effect of attention on neural coding, above and beyond what would be expected if a weak attentional enhancement was present in a majority of individual neurons.

