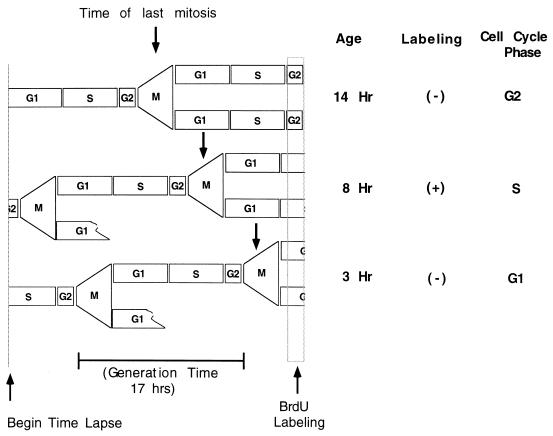
FIG. 2.
Time-lapse determination of approximate cell cycle position. The diagram illustrates the cycling characteristics of three typical cells in an asynchronous culture. At the beginning of the time-lapse analysis, these cells were in G1, G2, and S phases, respectively. The passage of these cells and their daughters through cell cycle periods is illustrated, together with the position of the final mitosis prior to the BrdU labeling period at the termination of the experiment. The age is the time between this final mitosis and the end of the BrdU labeling period, which is followed immediately by fixation of the cells. Labeling with BrdU identified the cell in S phase at the end of the experiment, while unlabeled cells, which could be in G1 or G2 phase, were distinguished by cell age.

