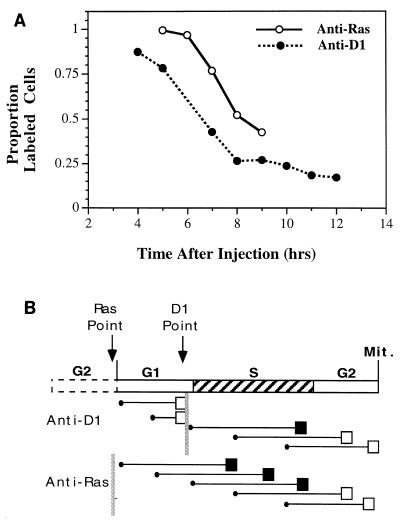
FIG. 7.
Kinetics of anti-Ras and anti-cyclin D1 inhibition. (A) To determine the cell cycle time at which Ras is required in cycling cells compared to cyclin D1, both antibodies were injected into several cultures of proliferating NIH 3T3 cells. These cultures were then pulsed with thymidine for 1 h at various times thereafter, fixed, stained with fluorescent antibodies against the injected antibody, and finally autoradiographed. The proportion of injected cells labeled with thymidine is plotted versus the time following injection at which the cells were fixed. (B) Results expected in a specific circumstance: when thymidine labeling followed injection by 5 h. The cell cycle is represented by the top bar, which indicates each cell cycle period and the points at which Ras and cyclin D1 are last required for cell cycle progression. Below this bar, each circle represents the position of individual cells in the cell cycle at the time of injection, horizontal lines represent progress through the cell cycle, boxes indicate whether the cells were labeled (filled box) or not (open box), and vertical lines indicate the points in the cell cycle at which Ras or cyclin D1 is last required prior to entry into S phase. Because the Ras requirement precedes mitosis, cells in G1 and early S phase at the time of injection become labeled following anti-Ras injection. Because anti-cyclin D1 blocks cell cycle progression just prior to S phase, on the other hand, only cells in early S phase at the time of injection are labeled following anti-cyclin D1 injection. This results in a lower labeling efficiency 5 h following injection of anti-cyclin D1 compared to anti-Ras.

