Figure 2.

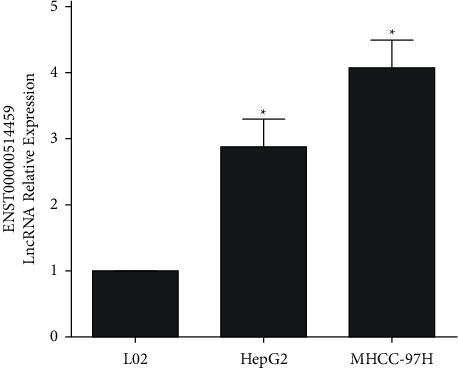
PCR results of TRPC7-AS1 expression in L02, HepG2, and MHCC97H cells. Data are presented as mean and standard deviation. ∗P < 0.05 vs. L02.

PCR results of TRPC7-AS1 expression in L02, HepG2, and MHCC97H cells. Data are presented as mean and standard deviation. ∗P < 0.05 vs. L02.