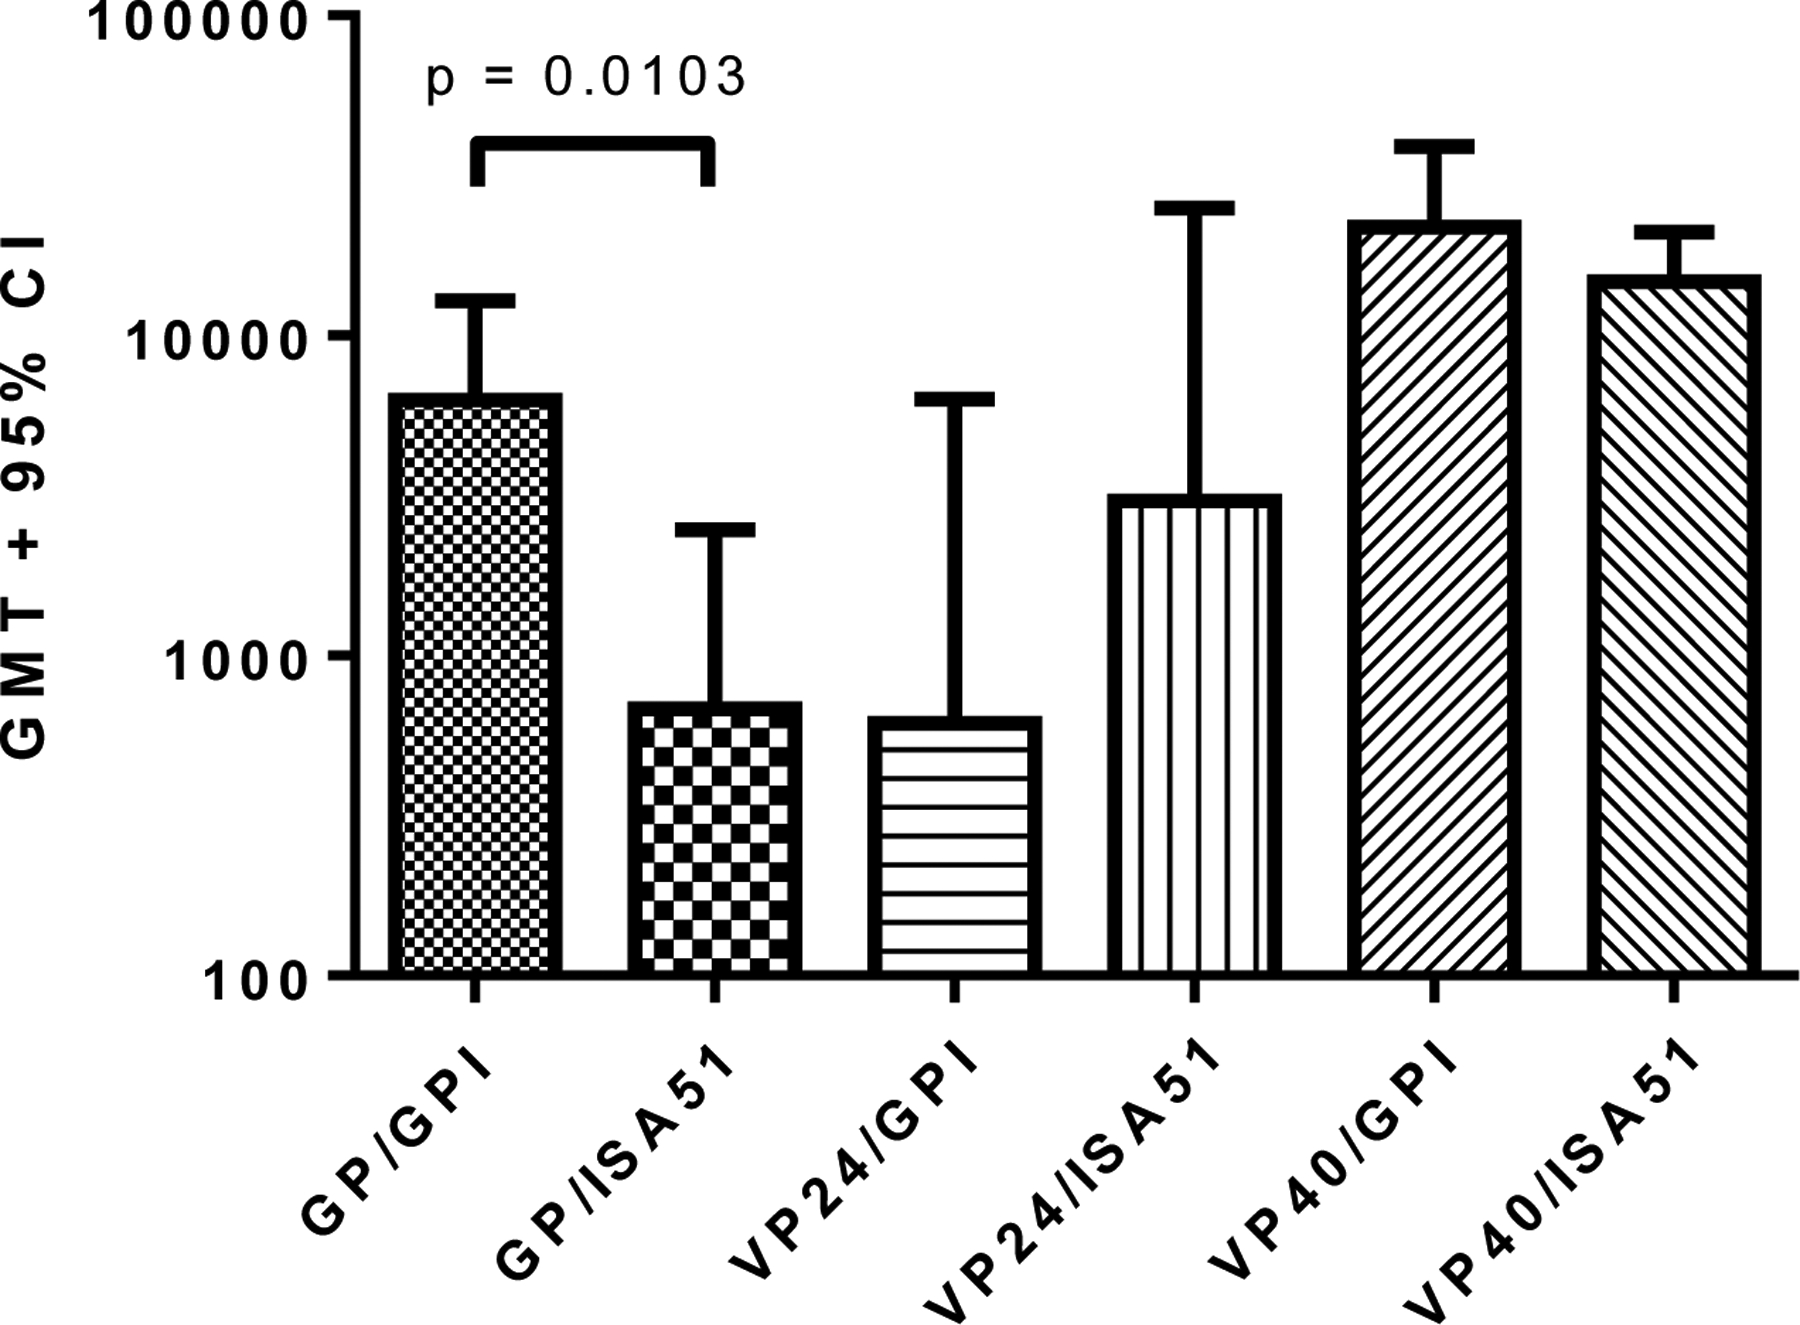
Figure 3. Humoral responses to recombinant EBOV antigens.

ELISA IgG antibody titers (EC50) calculated using a sigmoidal dose-response, variable slope program (Graphpad Prism). The GMT + 95% CI is plotted for each group (n=5). Plates were coated with the homologous immunizing antigen. Control groups (mice immunized with adjuvant only) were completely negative (EC50 values << lowest dilution tested, 1:250). Antibody titration curves for all groups including control groups are shown in Figure S5. Differences in antibody titers between GP/GPI-0100 and GP/ISA51 immunized groups were significant (p<0.05). Differences in antibody titers between VP24/GPI-0100 and VP24/ISA51 immunized groups, and between VP40/GPI-0100 and VP40/ISA51 immunized groups were not significant (p>0.05).
