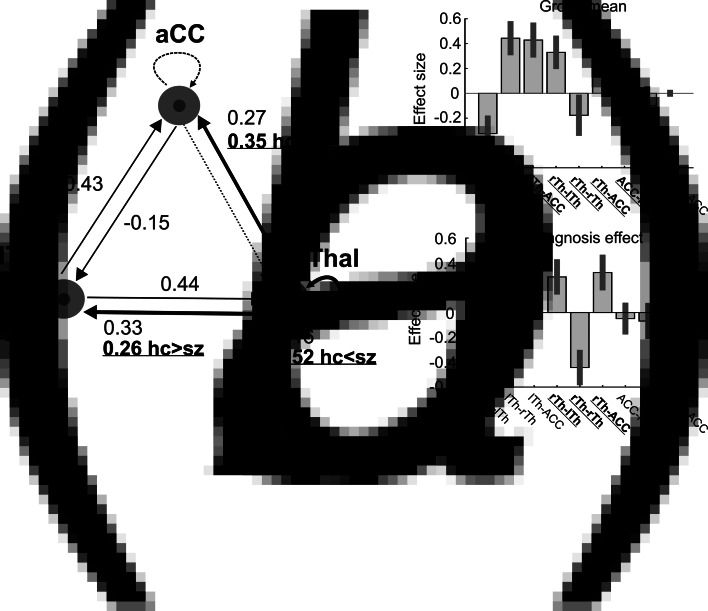
Fig. 1.
The dynamic causal model (DCM) of the thalamus hub network. (a) The thalamus hub network, where all lines (connections) constitute the full model we used. Solid lines show the winning model (connections with a probability >0.95), while dashed lines indicate connections not remaining in the model after PEB. Thick lines and labels in bold/underline font indicate connections differing between study groups (probability >0.95). (b) Estimated (posterior) connectivity parameters (effect sizes) for the whole sample (top) and for the diagnosis effect (bottom). Labels in bold/underline font show significant coupling parameters after PEB. Label abbreviations: lTh, left thalamus; rTh, right thalamus; ACC, anterior cingulate cortex.

