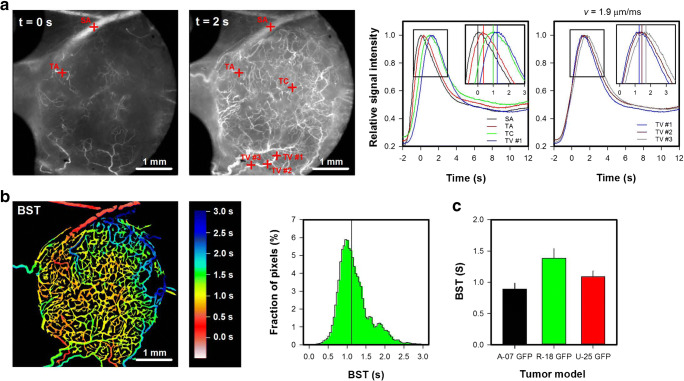
Fig. 4a.
Single frames from a first-pass imaging movie of a R18-GFP melanoma xenograft, and relative signal intensity versus time for the vessels marked in the frames. The entire first-pass imaging movie can be seen in Online Resource 1. The signal intensity curves refer to the main supplying artery (SA; black curve), a tumor arteriole (TA; red curve), a tumor capillary (TC; green curve), and a tumor venule (TV #1–3; blue, dark red, and gray curve). In the tumor venule, three regions of interest were selected. The delay in the signal intensity curves recorded along the tumor venule was used to calculate the blood flow velocity, which was 1.9 μm/ms. b Color-coded blood supply time image (BST) image and BST histogram of the R-18-GFP tumor. BST refer to the time arterial blood needs to flow from the main supplying artery to a tumor vessel, and was calculated from the delay in signal intensity curves for every vessel pixel. The BST scale is given by the color bar. The vertical line in the BST histogram shows median BST. c BST in A-07-GFP, R-18-GFP, and U-25-GFP melanoma xenografts. Columns, means of 7–17 tumors; bars, standard error. Fig. 4c was modified from Gaustad et al. [15]

