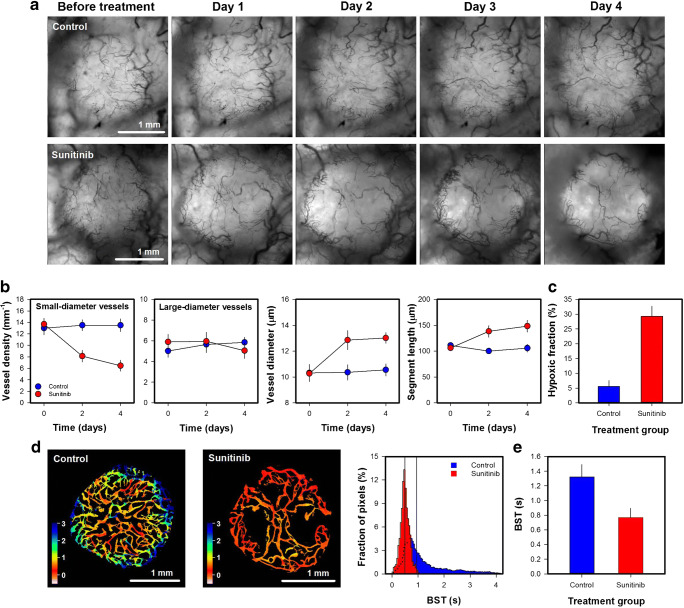
Fig. 7a.
Intravital microscopy images of an untreated (control) and a sunitinib-treated Capan-2 pancreatic ductal adenocarcinoma xenograft. The tumor-bearing mice were given daily doses of 40 mg/kg sunitinib or vehicle for 4 days. b Density of small-diameter vessels (< 10 μm), density of large-diameter vessels (> 10 μm), vessel diameter, and vessel segment length versus time in untreated and sunitinib-treated Capan-2 tumors. c Hypoxic fraction in untreated and sunitinib-treated Capan-2 tumors. The hypoxic fractions were determined by immuohistochemistry using pimonidazole as a hypoxia marker. d Blood supply time (BST) image and BST histogram of an untreated and a sunitinib-treated Capan-2 tumor. The BST scale is given by the color bar. The vertical lines in the BST histograms show median BST. e BST in untreated and sunitinib-treated tumors. Points and columns, means of 6–8 tumors; bars, standard error (b-c and e). Fig. 6b-c and e was modified from Gaustad et al. [47]

