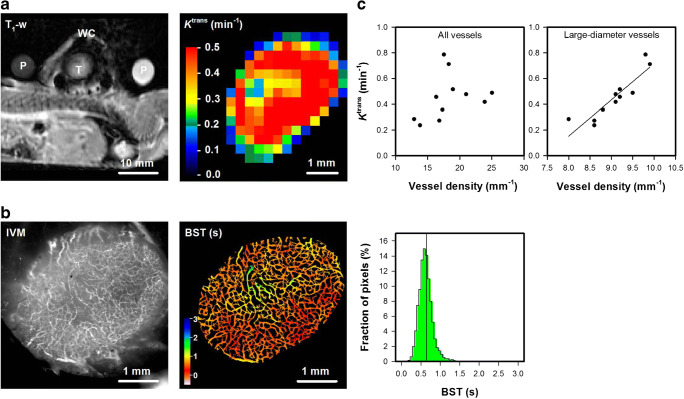
Fig. 8a.
A T1-weighted magnetic resonance (MR) image of calibration phantoms (P) and a mouse bearing a window chamber (WC) with an A07-GFP melanoma xenograft (T), and a color-coded Ktrans image of the A07-GFP tumor calculated from dynamic contrast-enhanced MR data by using Tofts generalized pharmacokinetic model. The Ktrans scale is given by the color bar. b Intravital microscopy image of TRITC-dextran filled tumor vessels and blood supply time (BST) image of the A-07-GFP tumor. The BST scales are given by the color bar. c Median Ktrans versus the density of all vessels and median Ktrans versus the density of large-diameter vessels (> 20 μm) in A-07-GFP tumors. Points, individual tumors. Fig. 8c was modified from Gaustad et al. [14]

