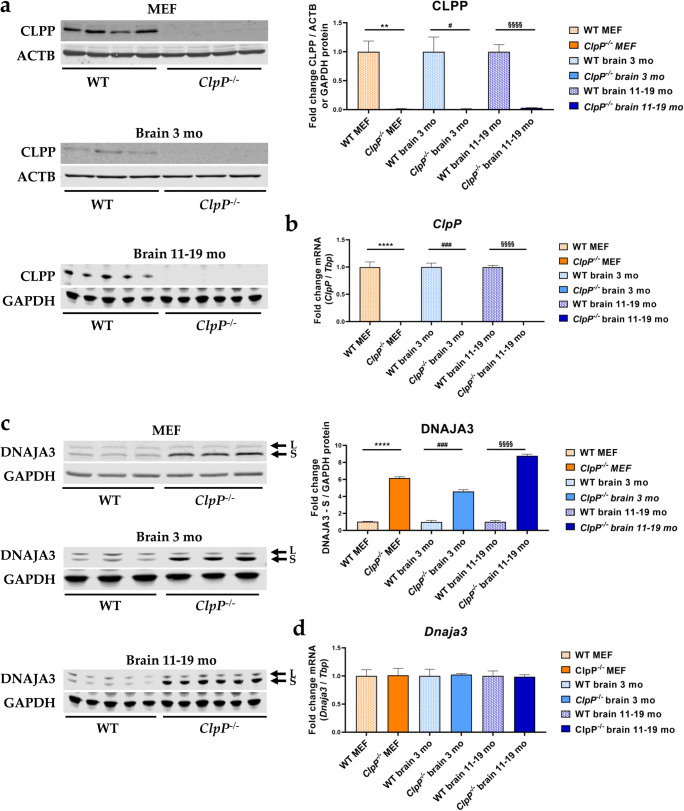
Fig. 3.
Verification of ClpP−/− genotype via a quantitative immunoblots and b RT-qPCRs and analysis of c DNAJA3 protein and d Dnaja3 mRNA levels, in MEFs and brain tissue of 3 versus 11–19-month-old mice. Immunoblots were normalized to ACTB or GAPDH, RT-qPCRs to Tbp levels. Data are presented as mean ± SEM. WTs are shown as checked, and ClpP−/− as plain colored bar graphs. Significances are illustrated by symbols: ** or §§ p < 0.01; ### p < 0.001; **** or §§§§ p < 0.0001; not significant (ns) p > 0.05. Asterisks portray significant differences between WT and ClpP−/− MEF, hashtags show significant effects in 3-month-old brain tissue between WT and ClpP−/− mice, and section signs visualize significant differences in brain tissue from 11–19-month-old mice, between WT and ClpP−/− genotypes. WT MEF: n= 4–5; ClpP−/− MEF: n= 3–5; WT brain 3 months: n= 3; ClpP−/− brain 3 months: n= 3; WT brain 11–19 months: n= 5; ClpP−/− brain 11–19 months: n= 6

