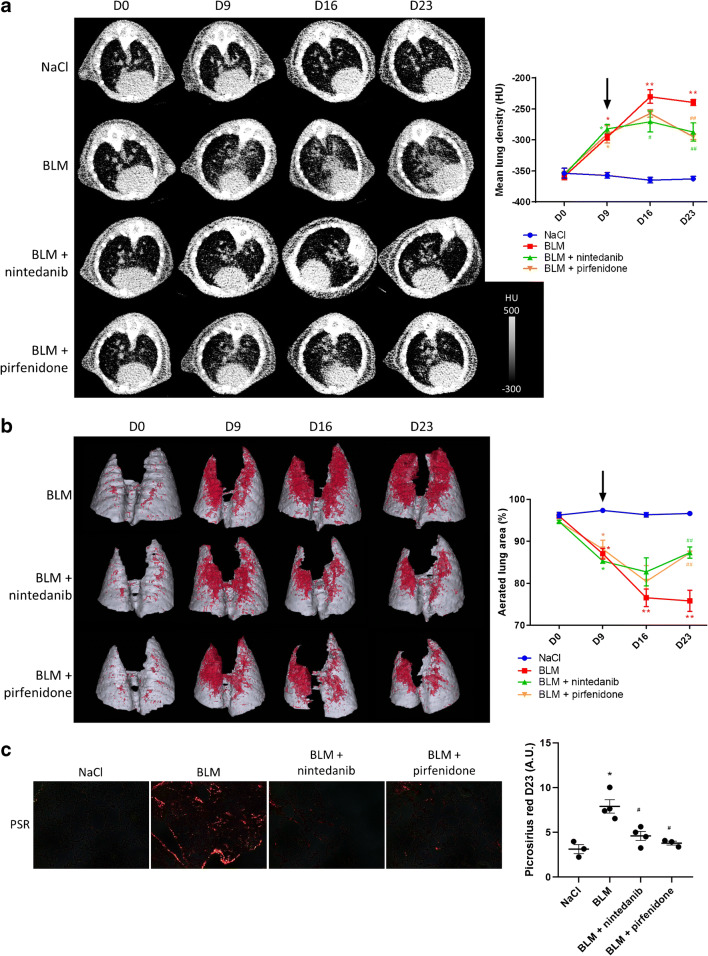
Fig. 4.
CT scan can detect lung fibrosis and efficacy of anti-fibrotic therapies. a Representative lung CT images of NaCl- and BLM-receiving mice treated or not with nintedanib of pirfenidone at D0, D9, D16 and D23. Graph represents evolution of the mean lung density quantified on CT images at all time points. Results are presented as mean ± SEM, n = 4 for NaCl and n = 5 for other groups. Stars (*) are representative of statistical comparison between time points for each group and hashes (#) are representative of statistical comparison between the groups at each time points. *(#)p < 0.05, **(##)p < 0.01. Black arrow represents the start of treatments. b Representative 3D reconstruction of lung 3DROI segmentation of lung CT images of NaCl- and BLM-receiving mice treated or not with nintedanib of pirfenidone at D0, D9, D16 and D23. Red represents high density lung areas (− 100 to 300 HU) representative of non-aerated lungs; grey represents normal density lung areas (− 800 to − 100 HU) representative of aerated lungs. Graph represents the percentage of evolution of aerated lung on CT images. Results are presented as mean ± SEM, n = 4 for NaCl and n = 5 for other groups. Stars (*) are representative of statistical comparison between time points for each group and hashes (#) are representative of statistical comparison between the groups at each time points. *p < 0.05, **(##)p < 0.01. Black arrow represents the start of treatments. c Representative Picrosirius red staining lung sections of NaCl- and BLM-receiving mice treated or not with nintedanib or pirfenidone at D23. Graph represents the intensity of picrosirius red staining. Results are presented as mean ± SEM, n = 3 for NaCl, n = 4 for BLM and BLM-nintedanib and n = 3 for BLM-pirfenidone. Stars (*) are representative of the comparison of each group with the NaCl group and hashes (#) are representative of statistical comparison of each group with BLM group *(#)p < 0.05

