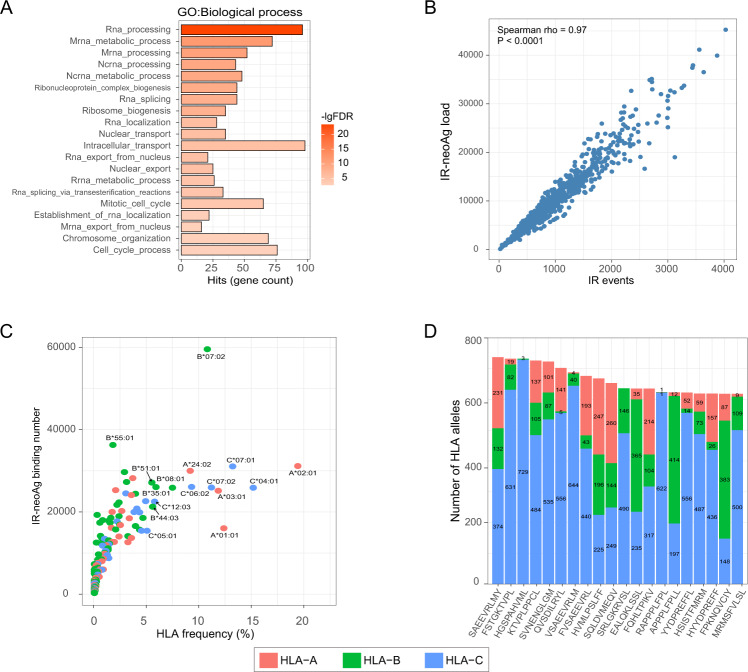
Fig. 2. MM-specific IR-neoAgs.
A Gene ontology enrichment analysis of genes harboring MM-specific IR events in specialized biological processes. B Scatter plot showing the number of IR events vs. IR-neoAg load in NDMM patients in the MMRF cohort. Each dot represents an individual patient (N = 767). Spearman correlation rho = 0.97, p value < 0.0001. C Scatterplot showing HLA allele frequency vs. the number of predicted IR-neoAgs bound in MMRF NDMM samples. D Top 20 most abundant IR-neoAg peptides and the number of HLA alleles in the MMRF NDMM samples predicted to bind each peptide; numbers in each bar represent the quantity of HLA allele subtypes.

